
Page 106 - JCAU-7-3
P. 106
Journal of Chinese
Architecture and Urbanism Seismic performance of reinforced SSPWs
as illustrated in Figure 1, was adopted. Given that the
objective was to determine the endpoint in the capacity
curve, it was observed that the curve became horizontal on
further increasing the applied force during the modeling
process. Therefore, the onset of this horizontal segment
was considered the termination point of the analysis for
all models.
The selected steel material was st37 steel, a common
structural steel type. As depicted in Figure 1, the first
segment’s slope, representing the elastic modulus of steel,
was set to 2.1×10 N/m . The yield stress was defined Figure 1. The ideal tri-linear curve representing steel behavior
11
2
as 2.4×10 N/m , the ultimate stress as 4×10 N/m , and Source: Graph by the authors.
8
2
2
8
Poisson’s ratio was taken as 0.3. In addition, the hardening
rate was set at 0.03, leading to a tangent elastic modulus A B
of 6.3×10 N/m in the second segment of the curve. The
2
9
von Mises yield criterion was employed, as it effectively
captures the response of steel. The same material properties
were applied in both compression and tension, adhering to
the kinematic hardening law.
To account for geometric non-linearities, large
deformation effects and stress stiffness were incorporated
in the ANSYS software (Ansys, Inc., United States). For
element selection, Beam188 elements were assigned to
beams, while Shell181 elements were used for columns and
infill steel plates.
To verify the accuracy of the FE model, including the
selected element types and material properties, a 4-story
steel plate shear wall system, experimentally tested by
Driver et al. (1998) under cyclic loading at the University
of Alberta, Canada, was replicated in ANSYS. Figure 2
illustrates the schematic of the experimental model of
Driver et al. (Driver et al., 1998) alongside the FE model Figure 2. The schematic of (A) experimental model (from Driver et al.
[1998]) and (B) numerical model in ANSYS (from the present study)
mesh of the present study used in the validation process. Source: Schematics by the authors.
The total height of the shear wall was 7,400 mm, with a
wall width of 3,400 mm, including the side columns. The Table 1. Mechanical specifications of the 4‑story model
1 -floor height was 1,930 mm, while the upper stories
st
measured approximately 1,830 mm each. The 1:2 scaled Element Yield stress Elastic modulus
2
2
model represented a system in which the infill steel plate (σy; N/mm ) (E, N/mm )
was welded to a special moment-resisting frame. The 1 - and 2 -floor steel plate 341 208, 800
nd
st
mechanical specifications of the test model are summarized 3 -floor steel plate 257 208, 800
rd
in Table 1. 4 -floor steel plate 262 208, 800
th
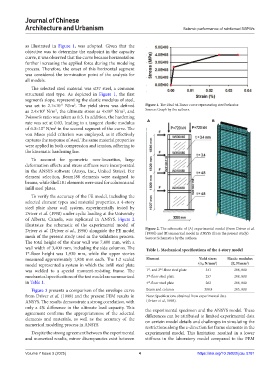
Figure 3 presents a comparison of the envelope curve Beam and column 308.8 203, 000
from Driver et al. (1998) and the present FEM results in Note: Specifications obtained from experimental data
ANSYS. The results demonstrate a strong correlation, with (Driver et al., 1998).
only a 4% difference in the ultimate load capacity. This the experimental specimen and the ANSYS model. These
agreement confirms the appropriateness of the selected differences can be attributed to limited experimental data
elements and materials, as well as the accuracy of the on certain model details and challenges in simulating the
numerical modeling process in ANSYS.
restrictions along the z-direction for frame elements in the
Despite the strong agreement between the experimental experimental model. This limitation resulted in a lower
and numerical results, minor discrepancies exist between stiffness in the laboratory model compared to the FEM
Volume 7 Issue 3 (2025) 4 https://doi.org/10.36922/jcau.5781