
Page 109 - JCAU-7-3
P. 109
Journal of Chinese
Architecture and Urbanism Seismic performance of reinforced SSPWs
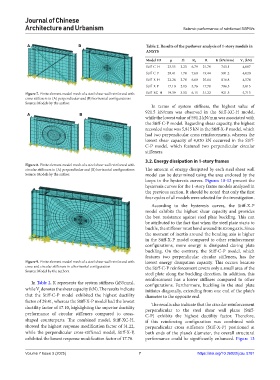
A B Table 2. Results of the pushover analysis of 1‑story models in
ANSYS
Model ID µ Ω Rµ R K (kN/mm) Vy (kN)
Stiff-C-H 23.55 2.23 6.79 21.79 743.1 4,087
Stiff-C-P 29.41 1.78 7.60 19.44 591.2 4,020
Stiff-X-H 22.26 2.70 6.60 25.64 816.8 4,574
Stiff-X-P 17.10 2.13 5.76 17.70 796.5 5,815
Figure 7. Finite element model mesh of a steel shear wall reinforced with Stiff-XC-H 19.39 3.53 6.15 31.22 921.5 5,713
cross stiffeners in (A) perpendicular and (B) horizontal configurations
Source: Models by the author.
In terms of system stiffness, the highest value of
921.5 kN/mm was observed in the Stiff-XC-H model,
A B
while the lowest value of 591.2 kN/mm was associated with
the Stiff-C-P model. Regarding shear capacity, the highest
recorded value was 5,815 kN in the Stiff-X-P model, which
had two perpendicular cross reinforcements, whereas the
lowest shear capacity of 4,020 kN occurred in the Stiff-
C-P model, which featured two perpendicular circular
stiffeners.
3.2. Energy dissipation in 1-story frames
Figure 8. Finite element model mesh of a steel shear wall reinforced with
circular stiffeners in (A) perpendicular and (B) horizontal configurations The amount of energy dissipated by each steel shear wall
Source: Models by the author. model can be determined using the area enclosed by the
loops in the hysteresis curves. Figures 10-12 present the
hysteresis curves for the 1-story frame models analyzed in
the previous section. It should be noted that only the first
four cycles of all models were selected for the investigation.
According to the hysteresis curves, the Stiff-X-P
model exhibits the highest shear capacity and provides
the best resistance against steel plate buckling. This can
be attributed to the fact that when the steel plate starts to
buckle, the stiffener must bend around its strong axis. Since
the moment of inertia around the bending axis is higher
in the Stiff-X-P model compared to other reinforcement
configurations, more energy is dissipated during plate
buckling. On the contrary, the Stiff-C-P model, which
features two perpendicular circular stiffeners, has the
Figure 9. Finite element model mesh of a steel shear wall reinforced with lowest energy dissipation capacity. This occurs because
cross and circular stiffeners in a horizontal configuration the Stiff-C-P reinforcement covers only a small area of the
Source: Model by the authors.
steel plate along the buckling direction. In addition, this
reinforcement has a lower stiffness compared to other
In Table 2, K represents the system stiffness (kN/mm), configurations. Furthermore, buckling in the steel plate
while V denotes the shear capacity (kN). The results indicate initiates diagonally, extending from one end of the plate’s
y
that the Stiff-C-P model exhibited the highest ductility diameter to the opposite end.
factor of 29.41, whereas the Stiff-X-P model had the lowest The results also indicate that the circular reinforcement
ductility factor of 17.10, highlighting the superior ductility perpendicular to the steel shear wall plane (Stiff-
performance of circular stiffeners compared to cross- C-P) exhibits the highest ductility factor. Therefore,
shaped counterparts. The combined model, Stiff-XC-H, if this reinforcing configuration was combined with
showed the highest response modification factor of 31.22, perpendicular cross stiffeners (Stiff-X-P) positioned at
while the perpendicular cross-stiffened model, Stiff-X-P, both ends of the plane’s diameter, the overall structural
exhibited the lowest response modification factor of 17.70. performance could be significantly enhanced. Figure 13
Volume 7 Issue 3 (2025) 7 https://doi.org/10.36922/jcau.5781