
Page 107 - JCAU-7-3
P. 107
Journal of Chinese
Architecture and Urbanism Seismic performance of reinforced SSPWs
non-linear dynamic analysis. However, due to its
computational intensity, designers often rely on simpler
analysis methods. One such method is non-linear static
analysis (also known as pushover analysis), which considers
the response modification factor. This factor provides
an estimate of the structure’s non-linear behavior. There
are two main approaches for determining the response
modification factor: (i) Young’s ductility coefficient and (ii)
Freeman’s capacity spectrum method.
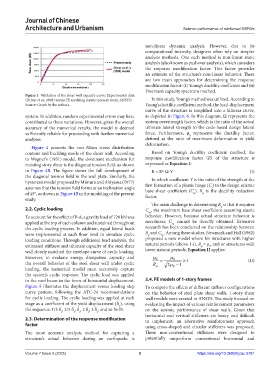
Figure 3. Validation of the shear wall capacity curve: Experimental data
(Driver et al., 1998) versus FE modeling results (present study, ANSYS) In this study, Young’s method was utilized. According to
Source: Graph by the authors. Young’s ductility coefficient method, the load-displacement
curve of the structure is simplified into a bilinear curve,
system. In addition, random experimental errors may have as depicted in Figure 6. In this diagram, Ω represents the
contributed to these variations. However, given the overall system overstrength factor, which is the ratio of the actual
accuracy of the numerical results, the model is deemed ultimate lateral strength to the code-based design lateral
sufficiently reliable for proceeding with further numerical force. Furthermore, µ represents the ductility factor,
s
analyses. defined as the ratio of maximum deformation to yield
deformation.
Figure 4 presents the von Mises stress distribution
contour and buckling mode of the shear wall. According Based on Young’s ductility coefficient method, the
to Wagner’s (1931) model, the dominant mechanism for response modification factor (R) of the structure is
resisting story shear is the diagonal tension field, as shown expressed as Equation I:
in Figure 4B. The figure shows the full development of R = R ⋅Ω⋅Y (I)
µ
the diagonal tension field in the wall plate. Similarly, the
hysteresis model proposed by Mimura and Akiyama (1977) In which coefficient Y is the ratio of the strength at the
assumes that the tension field forms at an inclination angle first formation of a plastic hinge (C ) to the design seismic
s
base shear coefficient (C ). R is the ductility reduction
of 45°, as shown in Figure 4B in the modeling of the present factor. w µ
study.
The main challenge in determining R is that it requires
µ
2.2. Cyclic loading C , the maximum base shear coefficient assuming elastic
eu
To account for the effect of P-Δ, a gravity load of 720 kN was behavior. However, because actual structure behavior is
applied at the top of each column and sustained throughout non-linear, C cannot be directly obtained. Extensive
eu
the cyclic loading process. In addition, equal lateral loads research has been conducted on the relationship between
were implemented at each floor level to simulate cyclic R and C . Among these studies, Newmark and Hall (1982)
µ
eu
loading conditions. Through additional load analysis, the proposed a new model where for structures with higher
estimated stiffness and ultimate capacity of the steel shear natural periods (above 1 s), R = µ , and or structures with
µ
s
wall closely matched the envelope curve of cyclic loading. lower natural periods, Equation II applies:
However, to evaluate energy dissipation capacity and µ S µ S
the overall behavior of the steel shear wall under cyclic R µ = 2 µ −1 ≥1 (II)
loading, the numerical model must accurately capture S
the system’s cyclic response. The cyclic load was applied
to the roof beam in the form of horizontal displacement. 2.4. FE models of 1-story frames
Figure 5 illustrates the displacement versus loading step To compare the effects of different stiffener configurations
curve pattern, following the ATC-24 recommendations on the behavior of steel plate shear walls, 1-story shear
for cyclic loading. The cyclic loading was applied at each wall models were created in ANSYS. The study focused on
stage as a coefficient of the yield displacement (δ ), using evaluating the impact of various reinforcement parameters
y
the sequence: 1/3 δ , 2/3 δ , δ , 2 δ , 3 δ , and so forth. on the seismic performance of shear walls. Given that
y
y
y
y
y
horizontal and vertical stiffeners are heavy and difficult
2.3. Determination of the response modification to implement, an alternative reinforcement approach
factor using cross-shaped and circular stiffeners was proposed.
The most accurate analysis method for capturing a These non-conventional stiffeners were designed to
structure’s actual behavior during an earthquake is potentially outperform conventional horizontal and
Volume 7 Issue 3 (2025) 5 https://doi.org/10.36922/jcau.5781