
Page 31 - JCBP-1-1
P. 31
Journal of Clinical and
Basic Psychosomatics Relationship between PD and melanoma based on NHANES
were conducted, with constant adjustment for covariates thus indicating an increased risk of melanoma in patients
in the multivariate logistic regression analysis to assess with PD.
the relationship between PD and melanoma. Results were
expressed as 95% confidence intervals (CI) and odds 3.3. Weighted multivariate logistic regression
ratios (OR) of p-values, and statistical significance was Table 3 presents the results of three weighted multivariate
determined at a two-tailed p < 0.05. Data sections in the logistic regression models examining the association
article were processed using R (http://www.R-project.org) between PD and melanoma. After adjusting for covariates,
and the “survey” package was utilized for data analysis. PD and melanoma were still significantly correlated.
Model 1 did not adjust for any covariates, and the results of
3. Results model 1 showed that the risk of melanoma was 8.321-fold
3.1. Participant characteristics greater in patients with PD than in the reference group,
using the non-PD group as a reference (OR, 8.321; 95%
A total of 5822 subjects were included in the study, CI, 1.007 – 68.787; p = 0.049). Model 2, after adjusting for
comprising 48 melanoma patients and 5774 non-melanoma age, gender, race, PIR, and BMI, revealed that patients in
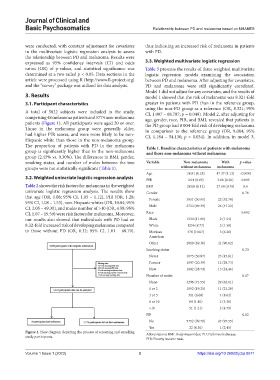
patients (Figure 1). All participants were aged 20 or over. the PD group had 8.004-fold risk of developing melanoma
Those in the melanoma group were generally older, in comparison to the reference group (OR, 8.004; 95%
had higher PIR scores, and were more likely to be non- CI, 1.184 – 54.130; p = 0.034). In addition, in model 3,
Hispanic white than those in the non-melanoma group.
The proportion of patients with PD in the melanoma Table 1. Baseline characteristics of patients with melanoma
group is significantly higher than in the non-melanoma and those non‑melanoma without melanoma
group (2.45% vs. 0.30%). The differences in BMI, gender,
smoking status, and number of moles between the two Variable Non‑melanoma With p‑value
groups were not statistically significant (Table 1). without melanoma melanoma
Age 38.81 (0.28) 47.37 (1.12) <0.0001
3.2. Weighted univariate logistic regression analysis PIR 3.04 (0.05) 3.66 (0.20) 0.003
Table 2 shows the risk factors for melanoma in the weighted BMI 28.08 (0.12) 27.68 (0.76) 0.6
univariate logistic regression analysis. The results show Gender 0.76
that age (OR, 1.08; 95% CI, 1.05 – 1.12), PIR (OR, 1.28; Female 3051 (50.61) 22 (52.78)
95% CI, 1.08 – 1.53), non-Hispanic whites (OR, 10.04; 95%
CI, 2.05 – 49.30), and moles number of >10 (OR, 4.58; 95% Male 2723 (49.39) 26 (47.22)
CI, 1.07 – 19.59) were risk factors for melanoma. Moreover, Race 0.002
our results also showed that individuals with PD had an Black 1230 (11.80) 2 (1.54)
8.32-fold increased risk of developing melanoma compared White 1256 (8.77) 2 (1.58)
to those without PD (OR, 8.32; 95% CI, 1.01 – 68.79), Mexican 478 (10.07) 3 (6.26)
American
Other 2810 (69.36) 41 (90.62)
Smoking status 0.23
Never 3075 (50.87) 23 (45.81)
Former 1097 (20.39) 12 (29.73)
Now 1602 (28.74) 13 (24.46)
Number of moles 0.17
None 4296 (71.55) 29 (62.01)
1 or 2 1052 (19.25) 11 (21.20)
3 or 5 311 (6.60) 4 (8.64)
6 or 10 64 (1.40) 2 (3.36)
>10 51 (1.21) 2 (4.79)
PD 0.02
No 5752 (99.70) 47 (97.55)
Yes 22 (0.30) 1 (2.45)
Figure 1. Flow diagram depicting the process of screening and enrolling Abbreviations: BMI: Body mass index; PD: Parkinson’s disease;
study participants.
PIR: Poverty income ratio.
Volume 1 Issue 1 (2023) 3 https://doi.org/10.36922/jcbp.0571