
Page 23 - JCBP-1-2
P. 23
Journal of Clinical and
Basic Psychosomatics Psychological control, sense of benefit, and burden on caregivers
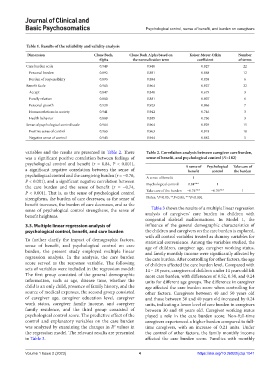
Table 1. Results of the reliability and validity analysis
Dimension Clone Bach, Clone Bach Alpha based on Kaiser‑Meyer‑Olkin Number
Alpha the normalization term coefficient of terms
Care burden scale 0.949 0.948 0.927 22
Personal burden 0.892 0.891 0.888 12
Burden of responsibility 0.893 0.894 0.858 6
Benefit Scale 0.963 0.964 0.927 22
Accept 0.847 0.848 0.679 3
Family relation 0.880 0.881 0.807 6
Personal growth 0.920 0.923 0.866 7
Human relations in society 0.941 0.942 0.746 3
Health behavior 0.889 0.889 0.730 3
Sense of psychological control scale 0.964 0.964 0.929 15
Positive sense of control 0.963 0.963 0.918 10
Negative sense of control 0.943 0.944 0.882 5
variables and the results are presented in Table 2. There Table 2. Correlation analysis between caregiver care burden,
was a significant positive correlation between feelings of sense of benefit, and psychological control (N=182)
psychological control and benefit (r = 0.84, P < 0.001), A sense of Psychological Take care of
a significant negative correlation between the sense of benefit control the burden
psychological control and the caregiving burden (r = −0.76, A sense of benefit 1
P < 0.001), and a significant negative correlation between
the care burden and the sense of benefit (r = −0.74, Psychological control 0.84*** 1
P < 0.001). That is, as the sense of psychological control Take care of the burden −0.74*** −0.76*** 1
strengthens, the burden of care decreases; as the sense of Notes: *P<0.05; **P<0.01; ***P<0.001.
benefit increases, the burden of care decreases, and as the
sense of psychological control strengthens, the sense of Table 3 shows the results of a multiple linear regression
benefit heightens. analysis of caregivers’ care burden in children with
congenital skeletal malformations. In Model 1, the
3.3. Multiple linear regression analysis of influence of the general demographic characteristics of
psychological control, benefit, and care burden the children and caregivers on the care burden is explored,
with all control variables treated as dummy variables for
To further clarify the impact of demographic factors, statistical convenience. Among the variables studied, the
sense of benefit, and psychological control on care age of children, caregiver age, caregiver working status,
burden, the present study employed multiple linear and family monthly income were significantly affected by
regression analysis. In the analysis, the care burden the care burden. After controlling for other factors, the age
score served as the response variable. The following of children affected the care burden level. Compared with
sets of variables were included in the regression model: 14 – 18 years, caregivers of children under 14 years old felt
The first group consisted of the general demographic more care burden, with differences of 0.52, 0.38, and 0.24
information, such as age, disease time, whether the units for different age groups. The difference in caregiver
child is an only child, presence of family history, and the age affected the care burden score when controlling for
source of medical expenses, the second group consisted other factors. Caregivers between 40 and 50 years old
of caregiver age, caregiver education level, caregiver and those between 30 and 40 years old increased by 0.24
work status, caregiver family income, and caregiver units, indicating a lower level of care burden in caregivers
family residence, and the third group consisted of between 30 and 40 years old. Caregiver working status
psychological control score. The predictive effect of the played a role in the care burden score. Non-full-time
control and explanatory variables on the care burden caregivers experienced a higher burden compared to full-
was analyzed by examining the changes in R values in time caregivers, with an increase of 0.21 units. Under
2
the regression model. The relevant results are presented the control of other factors, the family monthly income
in Table 3. affected the care burden score. Families with monthly
Volume 1 Issue 2 (2023) 4 https://doi.org/10.36922/jcbp.1041