
Page 24 - JCBP-1-2
P. 24
Journal of Clinical and
Basic Psychosomatics Psychological control, sense of benefit, and burden on caregivers
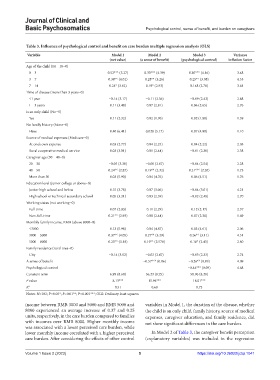
Table 3. Influence of psychological control and benefit on care burden multiple regression analysis (OLS)
Variable Model 1 Model 2 Model 3 Variance
(net value) (a sense of benefit) (psychological control) inflation factor
Age of the child (14 – 18=0)
0 – 3 0.52*** (5.27) 0.33*** (4.39) 0.30*** (4.16) 3.48
3 – 7 0.38** (4.01) 0.28** (3.26) 0.25** (3.08) 4.55
7 – 14 0.24* (3.62) 0.19* (2.93) 0.148 (2.78) 3.61
Time of disease (more than 3 years=0)
≤1 year −0.14 (3.17) −0.11 (2.56) −0.09 (2.42) 2.88
1 – 3 years 0.11 (3.48) 0.07 (2.81) 0.06 (2.65) 2.76
Is an only child (No=0)
Yes 0.11 (2.32) 0.02 (1.90) 0.02 (1.80) 1.59
No family history (None=0)
Have 0.40 (6.41) 0.028 (5.17) 0.07 (4.98) 1.10
Source of medical expenses (Medicare=0)
At one’s own expense 0.03 (2.77) 0.04 (2.25) 0.04 (2.22) 2.05
Rural cooperative medical service 0.03 (3.01) 0.01 (2.44) −0.01 (2.30) 2.38
Caregiver age (30 – 40=0)
20 – 30 −0.05 (3.30) −0.00 (2.67) −0.04 (2.54) 2.28
40 – 50 0.24** (2.87) 0.19** (2.32) 0.21*** (2.20) 1.75
More than 50 0.03 (5.90) 0.04 (4.76) 0.06 (4.51) 1.76
Education level (junior college or above=0)
Junior high school and below 0.15 (3.78) 0.07 (3.06) −0.04 (3.01) 4.21
High school or technical secondary school 0.05 (3.21) 0.03 (2.59) −0.02 (2.48) 2.70
Working status (not working=0)
Full-time 0.07 (2.83) 0.11 (2.29) 0.12 (2.17) 2.37
Non-full-time 0.21** (2.93) 0.08 (2.44) 0.07 (2.30) 1.69
Monthly family income, RMB (above 8000=0)
≤3000 0.13 (5.98) 0.04 (4.87) 0.03 (4.61) 2.06
3000 – 5000 0.37** (4.05) 0.27** (3.29) 0.26** (3.11) 4.51
5000 – 8000 0.25** (3.18) 0.19** (2.578) 0.18* (2.43) 2.80
Family residence (rural area=0)
City −0.14 (3.02) −0.03 (2.47) −0.03 (2.33) 2.74
A sense of benefit −0.57*** (0.06) −0.26** (0.09) 4.09
Psychological control −0.44*** (0.09) 4.68
Constant term 6.99 (8.60) 56.23 (8.75) 58.96 (8.28)
F value 8.13*** 15.94*** 18.01***
R 2 0.51 0.68 0.72
Notes: N=182; P<0.05*; P<0.01**; P<0.001***; OLS: Ordinary least squares.
income between RMB 3000 and 5000 and RMB 5000 and variables in Model 1, the duration of the disease, whether
8000 experienced an average increase of 0.37 and 0.25 the child is an only child, family history, source of medical
units, respectively, in the care burden compared to families expenses, caregiver education, and family residence, did
with incomes over RMB 8000. Higher monthly income not show significant differences in the care burden.
was associated with a lower perceived care burden, while
lower monthly income correlated with a higher perceived In Model 2 of Table 3, the caregiver benefit perception
care burden. After considering the effects of other control (explanatory variables) was included in the regression
Volume 1 Issue 2 (2023) 5 https://doi.org/10.36922/jcbp.1041