
Page 25 - JCBP-1-2
P. 25
Journal of Clinical and
Basic Psychosomatics Psychological control, sense of benefit, and burden on caregivers
model alongside the control variables. The benefit variable the ages of 30 – 40 years old. Moreover, caregivers with
improved the R of Model 2 by 0.17 – 0.68, indicating that higher household monthly incomes experienced a
2
the explanatory power of Model 2 is enhanced compared to lower care burden, whereas those with lower household
Model 1. The conclusion regarding the effect of the control monthly incomes felt a higher care burden.
variable on care burden in Model 2 is generally consistent (ii). When controlling for other factors, it was found that
with Model 1, except for the variable of caregiver working the higher the caregiver’s sense of benefit, the lower
status, which was not found to be significantly different in the care burden. The sense of benefit of the caregiver
Model 2. In addition, in the new Model 2, the caregiver negatively affects the care burden, which verifies the
benefit score demonstrated a significant negative effect third hypothesis of the research.
on the care burden score at a 0.001 significance level. (iii). When controlling for other factors, it was observed
After controlling for other variables, an average increase that a higher sense of psychological control is
of 1 unit in caregiver benefit perception was associated associated with a lower level of care burden. This
with a decrease of 0.57 units in care burden. The other finding confirms the first hypothesis of the research,
variables reached the same conclusions as those observed which suggests a negative relationship between the
in Model 1. sense of psychological control and the care burden.
In Model 3 of Table 3, both the sense of psychological 3.4. Analysis of the mediation effect of
control and benefit (explanatory variables) were added psychological control feeling, benefit feeling, and
to the regression model along with the control variables. care burden
The results in Model 3 are consistent with those in Model The correlation analysis between the above variables
2. Specifically, the newly included sense of psychological reveals a significant pairwise correlation among
control score showed a significant negative influence caregivers’ sense of psychological control, benefit, and
on care burden, with a significant level of 0.001. After care burden. Consequently, the present study further
controlling for other factors, an average increase of 1 tested the mediation effect of psychological control and
unit in the sense of psychological control was associated benefit on care burden. According to Zhonglin et al.,
with a decrease of 0.44 units in the care burden score. “Considering the influence of the independent variable X
This implies that the caregivers who have a higher sense on the dependent variable Y, if the independent variable
of psychological control experienced a lower level of care X has an effect on the dependent variable Y by affecting
burden. R of Model 3 increased to 0.72 after adding the the mediation variable M, M is called the intermediary
2
psychological control variables, which is an improvement variable. Among them, the mediation effect belongs
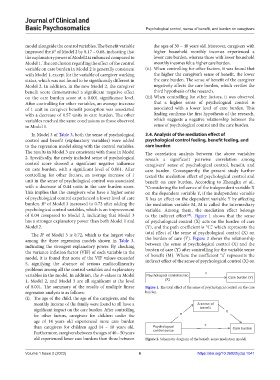
of 0.04 compared to Model 2, indicating that Model 3 to the indirect effect . Figure 1 shows that the sense
[18]
has a stronger explanatory power than both Model 1 and of psychological control (X) acts on the burden of care
Model 2. (Y), and the path coefficient is “C,” which represents the
2
The R of Model 3 is 0.72, which is the largest value total effect of the sense of psychological control (X) on
among the three regression models shown in Table 3, the burden of care (Y). Figure 2 shows the relationship
indicating the strongest explanatory power. By checking between the sense of psychological control (X) and the
the variance inflation factor (VIF) of each variable in the burden of care (Y) after controlling for the variable sense
model, it is found that none of the VIF values exceeded of benefit (M). Where the coefficient “a” represents the
5, signifying the absence of serious multicollinearity indirect effect of the sense of psychological control (X) on
problems among all the control variables and explanatory
variables in the model. In addition, the F-values in Model Psychological control sense c Care burden (Y)
1, Model 2, and Model 3 are all significant at the level (X)
of 0.001. The summary of the results of multiple linear Figure 1. The total effect of the sense of psychological control on the care
regression analysis is as follows: burden.
(i). The age of the child, the age of the caregivers, and the
monthly income of the family were found to all have a A sense of
significant impact on the care burden. After controlling benefit b
for other factors, caregivers for children under the a
age of 14 years old experienced more care burden
than caregivers for children aged 14 – 18 years old. Psychological c Care burden
Furthermore, caregivers between the ages of 40 – 50 years control sense
old experienced lower care burdens than those between Figure 2. Schematic diagram of the benefit-sense mediation model.
Volume 1 Issue 2 (2023) 6 https://doi.org/10.36922/jcbp.1041