
Page 71 - JCBP-3-2
P. 71
Journal of Clinical and
Basic Psychosomatics Evaluation of biopsychosocial factors
as well as between anxiety and mortality (P = 0.037; findings suggest that most parameters in the questionnaires
Table 5 and Figure 6). are significantly worse in patients who died during the
The collinearity observed among the questionnaires study period, with anxiety and depression — measured
(P < 0.01) indicates that poorer results on one test correlate by the HDAS, BPI, and SF-36 questionnaires — being key
with poorer results on the others. This observation reinforces predictors. Below, the correlations among the parameters
the validity of the patients’ responses across different of these three questionnaires are further demonstrated.
questionnaires. For example, lower functional status in the The canonical correlation between the dimensions
SF-36 correlated with greater interference in the BPI. The of the BPI and HADS questionnaires was statistically
significant (λ Wilks = 0.730, F (4, 250) = 10.667, P < 0.001),
with a moderate correlation between the canonical
variables (r = 0.519, P < 0.001). The explained variance
was approximately 27% (r = 0.269). Figure 7 illustrates
2
the correlations between the original variables and the
canonical variables. In addition, the correlation between
the dimensions of the SF-36 questionnaire was also
statistically significant (λ Wilks = 0.198, F (32, 418) = 7.184,
P < 0.001).
The correlation between the first canonical variables
was strong (r = 0.821, P < 0.001), explaining approximately
67% of the variance (r = 0.674). The figure below shows
2
the correlations between the original variables and the
first canonical variables, aiding in their interpretation. The
constructs associated with the canonical variables were
interpreted as factors. The concept of “daily performance”
was linked to the dimensions of the BPI and HADS
questionnaires, while the concept of “well-being” was
associated with the dimensions of the SF-36 questionnaire
(Figure 8).
The correlation between the second canonical variables
was moderate (r = 0.539, P < 0.001), with approximately
29% of the variance explained (r = 0.291). The constructs
2
related to these canonical variables were interpreted as
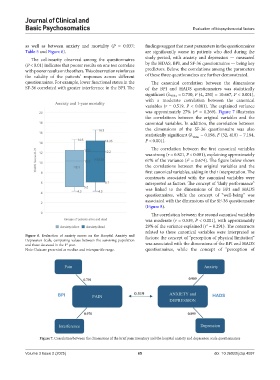
Figure 6. Evaluation of anxiety scores on the Hospital Anxiety and factors: the concept of “perception of physical limitation”
Depression Scale, comparing values between the surviving population
and those deceased in the 1 year. was associated with the dimensions of the BPI and HADS
st
Note: Data are presented as median and interquartile range. questionnaires, while the concept of “perception of
Figure 7. Correlation between the dimensions of the brief pain inventory and the hospital anxiety and depression scale questionnaires
Volume 3 Issue 2 (2025) 65 doi: 10.36922/jcbp.4097