
Page 100 - JCBP-3-3
P. 100
Journal of Clinical and
Basic Psychosomatics Sensitivity, self-esteem, and affective dependence
p<0.001) and negative correlations between the HSPS-FR affective dependence, where the model is significant and
and the RSES (r = −0.485, p<0.001) and between the explains approximately 15% of the variance (r = 0.145,
2
RSES and the ADS-9 (r = −0.395, p<0.001) (Table 4). All F [1, 98] = 16.667, p<0.001) (Table 6).
components of the HSPS are positively correlated with
each other (p<0.005). The components of the RSES are 3.4. Mediation effect of the RSES between the HSPS
positively correlated with each other (p<0.001), as are the and the affective dependence scale
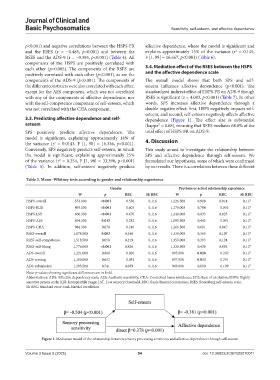
components of the ADS-9 (p<0.001). The components of The overall model shows that both SPS and self-
the different constructs were also correlated with each other, esteem influence affective dependence (p<0.001). The
except for the AES component, which was not correlated standardized indirect effect of HSPS-FR on ADS-9 though
with any of the components of affective dependence, nor RSES is significant (z = 4.083, p<0.001) (Table 7). In other
with the self-competence component of self-esteem, which words, SPS increases affective dependence through a
was not correlated with the CHA component. double negative effect: first, HSPS negatively impacts self-
esteem, and second, self-esteem negatively affects affective
3.3. Predicting affective dependence and self- dependence (Figure 1). The effect size is substantial
esteem (kappa² = 0.68), meaning that RSES mediates 68.8% of the
SPS positively predicts affective dependence. The total effect of HSPS-FR on ADS-9.
model is significant, explaining approximately 14% of
the variance (r = 0.0143, F [1, 98] = 16.336, p<0.001). 4. Discussion
2
Conversely, SPS negatively predicts self-esteem, in which This study aimed to investigate the relationship between
the model is significant, explaining approximately 25% SPS and affective dependence through self-esteem. We
of the variance (r = 0.254, F [1, 98] = 33.390, p<0.001) formulated our hypotheses, some of which were confirmed
2
(Table 5). In addition, self-esteem negatively predicts by our results. There is a correlation between these different
Table 3. Mann–Whitney tests according to gender and relationship experience
Gender Previous or actual relationship experience
W p RBC SE RBC W p RBC SE RBC
HSPS-overall 553.000 <0.001 −0.556 0.116 1,226.500 0.908 0.014 0.117
HSPS-EOE 495.000 <0.001 −0.603 0.116 1,170.000 0.784 −0.033 0.117
HSPS-LST 660.500 <0.001 −0.470 0.116 1,240.000 0.833 0.025 0.117
HSPS-AES 894.000 0.015 −0.282 0.116 1,099.500 0.442 −0.091 0.117
HSPS-CHA 984.500 0.070 −0.210 0.116 1,266.500 0.691 0.047 0.117
RSES-overall 1,678.500 0.003 0.348 0.116 1,339.000 0.365 0.107 0.117
RSES-self-competence 1,518.500 0.058 0.219 0.116 1,359.000 0.293 0.124 0.117
RSES-self-liking 1,776.000 <0.001 0.426 0.116 1,320.500 0.438 0.092 0.117
ADS-overall 1,221.000 0.868 −0.020 0.116 895.000 0.028 −0.260 0.117
ADS-craving 1,180.000 0.652 −0.053 0.116 857.000 0.013 −0.291 0.117
ADS-submission 1,293.500 0.741 0.039 0.116 969.000 0.090 −0.199 0.117
Note: p-values showing significant differences are in bold.
Abbreviations: ADS: Affective dependency scale; AES: Aesthetic sensitivity; CHA: Controlled harm avoidance; EOE: Ease of excitation; HSPS: Highly
sensitive person scale; IQR: Interquartile range; LST: Low sensory threshold; RBC: Rank-biserial correlation; RSES: Rosenberg self-esteem scale;
SE RBC: Standard error rank-biserial correlation.
Figure 1. Mediation model of the relationship between sensory processing sensitivity and affective dependence through self-esteem
Volume 3 Issue 3 (2025) 94 doi: 10.36922/JCBP025070011