
Page 60 - JCTR-10-1
P. 60
56 Cuenca-Martínez et al. | Journal of Clinical and Translational Research 2024; 10(1): 52-61
(mean differences [MD] = 0.37 L (0.17 – 0.56), P = 0.001, the AO group with a trivial effect size (MD = 0.1 L (0.02 – 0.16),
d = 0.51). In addition, the post hoc analysis revealed significant P = 0.008, d = 0.13).
inter-group differences between the AO and MI group with a large Moreover, the ANOVA revealed significant changes in the
effect size (MD = 0.724 L (0.07 – 1.37), P = 0.026, d = 1.41) FVC (%) parameter during time (F = 5.08, P = 0.033, ƞ = 0.17)
2
p
(Figure 3). but not, during group * time interaction (F = 1.19, P = 0.32,
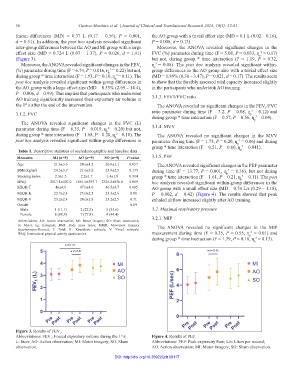
Moreover, the ANOVA revealed significant changes in the FEV ƞ = 0.08). The post hoc analysis revealed significant within-
2
p
1
(%) parameter during time (F = 6.74, P = 0.016, ƞ = 0.22) but not, group differences in the AO group also with a trivial effect size
2
p
during group * time interaction (F = 1.93, P = 0.16, ƞ = 0.11). The (MD = 1.89% (0.30 – 3.47), P = 0.021, d = 0.17). The results seem
2
p
post hoc analysis revealed significant within-group differences in to show that the forcibly assessed vital capacity increased slightly
the AO group with a large effect size (MD = 8.55% (2.69 – 14.4), in the participants who undertook AO training.
P = 0.006, d = 0.99). This implies that participants who underwent
AO training significantly increased their expiratory air volume in 3.1.3. FEV1/FVC ratio
the 1 s after the end of the intervention. The ANOVA revealed no significant changes in the FEV /FVC
st
1
2
3.1.2. FVC ratio parameter during time (F = 3.2, P = 0.08, ƞ = 0.12) and
p
during group * time interaction (F = 0.57, P = 0.56, ƞ = 0.04).
2
p
The ANOVA revealed significant changes in the FVC (L)
parameter during time (F = 6.35, P = 0.019, ƞ = 0.20) but not, 3.1.4. MVV
2
p
during group * time interaction (F = 1.68, P = 0.20, ƞ = 0.10). The The ANOVA revealed no significant changes in the MVV
2
p
post hoc analysis revealed significant within-group differences in parameter during time (F = 1.73, P = 0.20, ƞ = 0.06) and during
2
p
group * time interaction (F = 0.51, P = 0.60, ƞ = 0.041).
2
Table 1. Descriptive statistics of sociodemographic and baseline data p
Measures MI (n=9) AO (n=9) SO (n=9) P‑value 3.1.5. PEF
Age 21.6±3.6 24.6±4.2 20.9±1.1 0.057 The ANOVA revealed significant changes in the PEF parameter
BMI (kg/m ) 24.5±3.7 21.6±3.8 23.9±2.5 0.173 during time (F = 13.77, P = 0.001, ƞ = 0.36), but not during
2
2
p
Smoking index 2.3±1.5 2.2±1.7 1.4±1.0 0.314 group * time interaction (F = 1.61, P = 0.21, ƞ = 0.11). The post
2
p
IPAQ 2517.1±407.0 1861.6±397.7 2326.5±836.8 0.069 hoc analysis revealed significant within-group differences in the
MIQR-T 46±4.6 47.0±4.0 46.5±4.7 0.895 AO group with a small effect size (MD = 0.74 L/s (0.29 – 1.18),
MIQR-K 22.7±2.4 23.0±2.5 23.3±2.6 0.88 P = 0.002, d = 0.42) (Figure 4). The results showed that peak
MIQR-V 23.2±2.4 24.0±1.8 23.2±2.5 0.71 exhaled airflow increased slightly after AO training.
Gender 0.09
Male 1 (11.1) 2 (22.2) 5 (55.6) 3.2. Maximal respiratory pressure
Female 8 (88.9) 7 (77.8) 4 (44.4)
Abbreviations: AO: Action observation; MI: Motor imagery; SO: Sham observation; 3.2.1. MIP
m: Meter; kg: Kilogram; BMI: Body mass index; MIQR: Movement Imagery The ANOVA revealed no significant changes in the MIP
Questionnaire-Revised; T: Total; K: Kinesthetic subscale; V: Visual subscale;
2
IPAQ: International physical activity questionnaire. measurement during time (F = 0.35, P = 0.55, ƞ = 0.01) and
p
during group * time interaction (F = 1.79, P = 0.18, ƞ = 0.13).
2
p
Figure 3. Results of FEV .
1
Abbreviations: FEV : Forced expiratory volume during the 1 s; Figure 4. Results of PEF.
st
1
L: liters; AO: Action observation; MI: Motor imagery; SO: Sham Abbreviations: PEF: Peak expiratory flow; L/s: Liters per second;
observation. AO: Action observation; MI: Motor imagery; SO: Sham observation.
DOI: http://doi.org/10.36922/jctr.00117