
Page 59 - JCTR-10-1
P. 59
Cuenca-Martínez et al. | Journal of Clinical and Translational Research 2024; 10(1): 52-61 55
respiratory maneuvers required to perform spirometry, nasal included the IPAQ form and a questionnaire about age, gender,
clips were placed to prevent air leakage through the nose. The weight, height, and smoking index. Then, MIQ-R was assessed.
participant was then instructed to undertake an initial maximal Each participant was then seated and underwent an assessment
inspiration to reach total lung capacity, followed by a forced of pre-intervention outcome measures (pulmonary function
maximal expiration for at least 6 seconds until its expiratory limit tests through forced spirometry and maximal static respiratory
was reached. To ensure proper test execution, the maneuver was pressure). At this time and in a sitting position, patients performed
repeated at least three times (up to a maximum of eight times), the MI training, AO protocol, or SO according to the randomized
with a 1-min break in between repetitions. As advised by the ATS, allocation. Immediately after the intervention, a blinded evaluator
spirometry maneuvers with performance artifacts or variations of measured all outcome measures (post-intervention). In addition,
more than 0.150 L between the highest FEV and or FVC values just at the end of the intervention, perceived mental training
1
/
were discarded. The three repeats’ greatest value was recorded fatigue was also assessed.
(Figure 2).
2.9. Data analysis
2.7.3. Secondary outcomes
The statistical data analysis was performed using statistical
(A) Maximal inspiratory (MIP)/expiratory pressure (MEP) SPSS software version 25.0 (SPSS Inc., Chicago, IL, USA).
The MIP and MEP pressures were measured using a The normality of the variables was evaluated by the Shapiro –
digital respiratory dynamometer (MicroRPM, CareFusion, Wilk test. Descriptive statistics were used to summarize the data
Basignstoke, UK) [41]. To minimize air leakage through the for continuous variables and are presented as mean ± standard
nose during testing, nasal clips were placed on the subjects deviation, with 95% confidence interval. The categorical
who were seated. Patients were instructed to exert their hardest variables are presented as absolute (number) and relative
possible inhalation and exhalation efforts and hold them for frequencies (percentage). A two-way repeated measures analysis
at least 1.5 seconds. To obtain the maximum value of three of variance (ANOVA) was conducted to study the effect of the
maneuvers with <10% variation, MIP was evaluated at residual between-participant “intervention group” factor on each of the
volume and MEP at total lung capacity according to the ATS three categories (MI, AO, and SO) and the within-participant
statement [41] (Figure 2). “time” factor, as well as on each of two categories (pre- and
post-intervention) of all the dependent variables. A post hoc
(B) Perceived fatigue analysis with Bonferroni correction was performed in the case of
We employed the Visual Analog Scale of fatigue (VAS-f) to significant ANOVA findings for multiple comparisons between
quantify the participants’ perceived fatigue after performing variables. Effect sizes (d) were calculated according to Cohen’s
the training session. The VAS-f uses an analog scale of 0 – method, in which the magnitude of the effect was classified as
100 mm, with 0 representing minimum fatigue (no fatigue) and small (0.20 – 0.49), moderate (0.50 – 0.79), or large (0.8) [43].
100 representing maximum fatigue. The VAS-f scale is useful, The α level was set at 0.05 for all tests. In addition, we compared
sensitive, and easy to apply [42]. the baseline variables between groups with a one-factor ANOVA
2.8. Procedures to explore whether the groups were homogeneous at the start
of the study. The perceived fatigue outcome measure was also
Each participant completed an informed consent document to explored with a one-factor ANOVA.
participate in the study, in addition to a set of questionnaires to
complete before starting the intervention. These questionnaires 3. Results
A total of 27 mild smokers participants were included and were
randomly allocated into three groups of 9 participants per group.
All the variables presented a normal distribution. No statistically
significant differences were found between groups for any of the
primary variables, demographic data or self-report variables were
present at baseline between the groups (Table 1). There were no
adverse events reported in either group.
3.1. Pulmonary function
3.1.1. FEV 1
The ANOVA revealed significant changes in the FEV
1
(L) parameter during time (F = 10.52, P = 0.003, ƞ = 0.305)
2
p
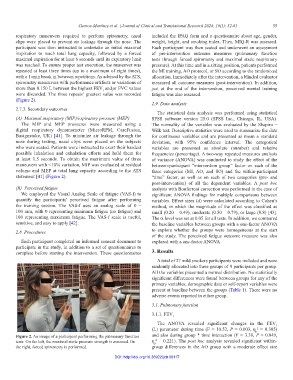
Figure 2. An image of a participant performing the pulmonary function and also during group * time interaction (F = 3.39, P = 0.049,
2
tests. On the left, the maximal static pressure strength is assessed. On ƞ = 0.221). The post hoc analysis revealed significant within-
p
the right, forced spirometry is performed. group differences in the AO group with a moderate effect size
DOI: http://doi.org/10.36922/jctr.00117