
Page 61 - JCTR-10-1
P. 61
Cuenca-Martínez et al. | Journal of Clinical and Translational Research 2024; 10(1): 52-61 57
3.2.2. MEP
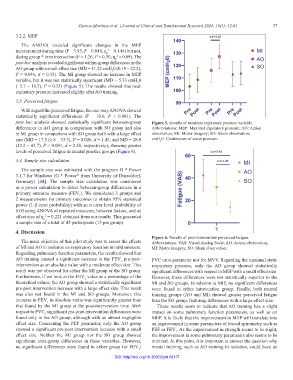
The ANOVA revealed significant changes in the MEP
measurement during time (F = 3.95, P = 0.048, ƞ = 0.144) but not,
2
p
during group * time interaction (F = 1.26, P = 0.30, ƞ = 0.09). The
2
p
post hoc analysis revealed significant within-group differences in the
AO group with a small effect size (MD = 11.22 cmH 0 (0.19 – 22.2),
2
P = 0.046, d = 0.33). The MI group showed an increase in MEP
variable, but it was not statistically significant (MD = 5.33 cmH 0
2
(−5.7 – 16.3), P = 0.33) (Figure 5). The results showed that peak
expiratory pressure increased slightly after AO training.
3.3. Perceived fatigue
With regard the perceived fatigue, the one-way ANOVA showed
statistically significant differences (F = 10.6, P < 0.001). The
post hoc analysis showed statistically significant between-group Figure 5. Results of maximal expiratory pressure variable.
differences in AO group in comparison with SO group and also Abbreviations: MEP: Maximal expiratory pressure; AO: Action
in MI group in comparison with SO group both with a large effect observation; MI: Motor imagery; SO: Sham observation;
size (MD = 17.5 (1.8 – 33.3), P = 0.026, d = 1.45, and MD = 28.0 cmH 0: Centimeters of water pressure.
2
(12.2 – 43.7), P < 0.001, d = 2.58, respectively), showing greater
levels of perceived fatigue in mental practice groups (Figure 6).
3.4. Sample size calculation
The sample size was estimated with the program G * Power
3.1.7 for Windows (G * Power from University of Dusseldorf,
©
Germany) [44]. The sample size calculation was considered
as a power calculation to detect between-group differences in a
primary outcome measure (FEV ). We considered 3 groups and
1
2 measurements for primary outcomes to obtain 95% statistical
power (1-β error probability) with an α error level probability of
0.05 using ANOVA of repeated measures, between factors, and an
effect size of = 0.221 obtained from our results. This generated
2
a sample size of a total of 45 participants (15 per group).
4. Discussion
Figure 6. Results of post-intervention perceived fatigue.
The main objective of this pilot study was to assess the effects Abbreviations: VAS: Visual Analog Scale; AO: Action observation;
of MI and AO in isolation on respiratory function in mild smokers. MI: Motor imagery; SO: Sham observation.
Regarding pulmonary function parameters, the results showed that
AO training caused a significant increase in the FEV pre-post- FVC ratio parameter nor for MVV. Regarding the maximal static
1
intervention as an absolute value with a moderate effect size. This respiratory pressure, only the AO group showed statistically
result was not observed for either the MI group or the SO group. significant differences with respect to MEP with a small effect size.
Furthermore, if we look at the FEV value as a percentage of the However, these differences were not statistically superior to the
1
theoretical values, the AO group showed a statistically significant MI and SO groups. In relation to MIP, no significant differences
pre-post intervention increase with a large effect size. This result were found in either intervention group. Finally, both mental
was also not found in the MI and SO groups. Moreover, this training groups (AO and MI) showed greater perceived fatigue
increase in FEV in absolute value was significantly greater than than the SO group, featuring differences with a large effect size.
1
that found by the MI group at the post-intervention time. With These results seem to indicate that AO training has a slight
respect to FVC, significant pre-post-intervention differences were impact on some pulmonary function parameters, as well as on
found only in the AO group, although with an almost negligible MEP. It is likely that the improvement in MEP will translate into
effect size. Concerning the PEF parameter, only the AO group an improvement in some parameters of forced spirometry such as
showed a significant pre-post-intervention increase with a small PEF or FEV . As the improvement in strength seems to be slight,
1
effect size. Neither the MI group nor the SO group showed the improvement in some pulmonary parameters also seems to be
significant intra-group differences in these variables. However, minimal. At this point, it is important to answer the question why
no significant differences were found in either group for FEV / mental training, such as AO training in isolation, could have an
1
DOI: http://doi.org/10.36922/jctr.00117