
Page 73 - JCTR-10-2
P. 73
Ezenekwe et al. | Journal of Clinical and Translational Research 2024; 10(2): 165-171 167
Patients with hyperparathyroidism
with 4D-CT imaging
n = 144
No parathyroidectomy
or unsuccessful
parathyroidectomy
n = 24
n = 120
Unavailable
intraoperative surgical
pathology results
n = 2
n = 118
Inaccurate
localization of
parathyroid adenoma
n = 35
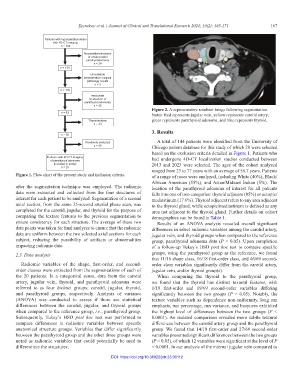
Figure 2. A representative resultant image following segmentation.
n = 83
Notes: Red represents jugular vein, yellow represents carotid artery,
Thyroidectomy green represents parathyroid adenoma, and blue represents thyroid.
n = 33
3. Results
n = 50
Randomly excluded A total of 144 patients were identified from the University of
n = 30 Chicago patient database for this study of which 20 were selected
based on the exclusion criteria detailed in Figure 1. Patients who
Patients with 4D-CT imaging had undergone 4D-CT localization studies conducted between
of parathyroid adenoma
(included in study) 2013 and 2023 were selected. The ages of the cohort analyzed
n = 20
ranged from 23 to 77 years with an average of 56.7 years. Patients
Figure 1. Flow chart of the present study and inclusion criteria. of a range of races were analyzed, including White (40%), Black/
African American (55%), and Asian/Mideast Indian (5%). The
after the segmentation technique was employed. The radiomic location of the parathyroid adenoma of interest for all patients
data were extracted and collected from the four structures of falls into one of two categories: thyroid adjacent (85%) or ectopic/
interest for each patient to be analyzed. Segmentation of a second mediastinum (17.6%). Thyroid adjacent refers to any area adjacent
axial section, from the same 25-second arterial phase scan, was to the thyroid gland, while ectopic/mediastinum is defined as any
completed for the carotid, jugular, and thyroid for the purpose of area not adjacent to the thyroid gland. Further details on cohort
comparing the texture features to the previous segmentation to demographics can be found in Table 1.
ensure consistency for each structure. The average of these two Results of an ANOVA analysis revealed overall significant
data points was taken for final analyses to ensure that the radiomic differences in select radiomic variables among the carotid artery,
data are uniform between the two selected axial sections for each jugular vein, and thyroid groups when compared to the reference
subject, reducing the possibility of artifacts or abnormalities group, parathyroid adenoma data (P < 0.05). Upon completion
impacting radiomic data. of a follow-up Tukey’s HSD post hoc test to compare specific
2.3. Data analysis groups, using the parathyroid group as the reference, we found
that 11/16 shape class, 16/18 first-order class, and 46/69 second-
Radiomic variables of the shape, first-order, and second- order class variables significantly differ from the carotid artery,
order classes were extracted from the segmentations of each of jugular vein, and/or thyroid group(s).
the 20 patients. In a categorical sense, data from the carotid When comparing the thyroid to the parathyroid group,
artery, jugular vein, thyroid, and parathyroid adenoma were we found that the thyroid has distinct textural features, with
referred to as four distinct groups: carotid, jugular, thyroid, 1/18 first-order and 19/69 second-order variables differing
and parathyroid groups, respectively. Analysis of variance significantly between the two groups (P < 0.05). Notably, the
(ANOVA) was conducted to assess if there are statistical texture variables such as dependence non-uniformity, long run
differences between the carotid, jugular, and thyroid groups emphasis, run percentage, run variance, and busyness exhibited
when compared to the reference group, i.e., parathyroid group. the highest level of differences between the two groups (P <
Subsequently, Tukey’s HSD post hoc test was performed to 0.0001). An isolated comparison revealed more subtle textural
compare differences in radiomic variables between specific differences between the carotid artery group and the parathyroid
anatomical structure groups. Variables that differ significantly group. We found that 14/18 first-order and 27/69 second-order
between the parathyroid group and the other three groups were variables presented significant differences between the two groups
noted as radiomic variables that could potentially be used to (P < 0.05), of which 12 variables were significant at the level of P
differentiate the structures. < 0.0001. In our analysis of the internal jugular vein compared to
DOI: https://doi.org/10.36922/jctr.23.00112