
Page 76 - JCTR-10-2
P. 76
170 Ezenekwe et al. | Journal of Clinical and Translational Research 2024; 10(2): 165-171
In addition, parathyroid lesions are most often located directly and performance of different models [14]. Considering the recent
adjacent to the thyroid, making it difficult for radiologists and success of other applications of radiomic data in the field, findings
computers alike to distinguish between the two with a high level of this study are anticipated to make a meaningful contribution
of confidence. Thus, our selection and comparison of the thyroid to to future advances in parathyroid adenoma identification and
parathyroid lesions in this study are particularly important. Our data localization. Ultimately, the ability to non-invasively localize
suggest that parathyroid lesions are associated with a unique set of parathyroid adenomas preoperatively could in turn translate to
radiomic variables when compared to the thyroid. These distinct, broader utilization of MIP, resulting in overall improved clinical
quantifiable differences revealed will be of use in creating a texture outcomes [1,2].
signature specific to parathyroid adenomas. This signature could Several limitations of this study should be acknowledged. The
utilize dimensional and textural differences between the parathyroid most prominent shortcoming of this study is that the relatively
adenoma and surrounding anatomy to create models that predict small sample size was n=20. In addition, the retrospective nature
potential lesions and more precisely localize parathyroid adenomas. of the study and selection bias might influence the generalizability
Naturally, the next step in our application of this data is to of the results. Further investigation is needed to validate our
investigate the performance of a parathyroid adenoma texture findings and warrant application in a clinical setting.
signature in models differentiating lesions from surrounding neck 5. Conclusion
anatomy on 4D-CTs. For example, a recent study has had moderate
success using imaging characteristics of parathyroid adenomas to Our observations grounded in the statistical significance of
predict the pathology of anterior mediastinal masses [13]. Another several radiomic variables within the shape, first-order, and
study achieved notable results by applying radiomic data extracted second-order feature classes in differentiating parathyroid
from parathyroid scintigraphy to algorithms to compare the utility adenoma from surrounding neck anatomy, such as carotid artery,
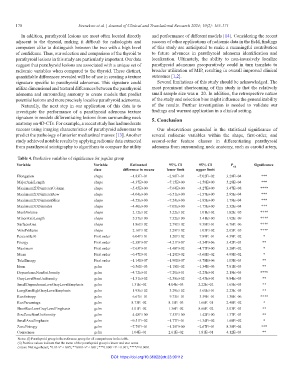
Table 4. Predictive variables of significance for jugular group
Variable Variable Estimated 95% CI 95% CI P adj Significance
class difference in means lower limit upper limit
Elongation shape −1.83E−01 −2.96E−01 −7.02E−02 3.29E−04 ***
MajorAxisLength shape −4.37E+00 −7.15E+00 −1.59E+00 5.28E−04 ***
Maximum2DDiameterColumn shape −5.45E+00 −7.64E+00 −3.27E+00 3.47E−08 ****
Maximum2DDiameterRow shape −4.04E+00 −6.51E+00 −1.57E+00 2.95E−04 ***
Maximum2DDiameterSlice shape −4.55E+00 −7.24E+00 −1.85E+00 1.79E−04 ***
Maximum3DDiameter shape −4.40E+00 −7.05E+00 −1.75E+00 2.32E−04 ***
MeshVolume shape −2.12E+02 −3.22E+02 −1.01E+02 1.82E−05 ****
MinorAxisLength shape −5.37E+00 −7.32E+00 −3.41E+00 1.92E−09 ****
SurfaceArea shape −1.86E+02 −2.79E+02 −9.38E+01 6.76E−06 ****
VoxelVolume shape −2.16E+02 −3.29E+02 −1.03E+02 2.05E−05 ****
Percentile10 First order −6.04E+01 −1.20E+02 −7.89E−01 4.59E−02 *
Energy First order −2.38E+07 −4.21E+07 −5.54E+06 5.42E−03 **
Maximum First order −7.63E+01 −1.48E+02 −4.77E+00 3.20E−02 *
Mean First order −6.47E+01 −1.29E+02 −3.60E−02 4.98E−02 *
TotalEnergy First order −1.14E+07 −1.90E+07 −3.78E+06 1.05E−03 **
Idmn gclm −6.56E−03 −1.18E−02 −1.34E−03 7.91E−03 **
DependenceNonUniformity gclm −4.72E+01 −7.20E+01 −2.23E+01 2.19E−05 ****
GrayLevelNonUniformity gclm −1.31E+02 −2.38E+02 −2.43E+01 9.84E−03 **
SmallDependenceLowGrayLevelEmphasis gclm 1.31E−02 4.04E−03 2.22E−02 1.65E−03 **
LongRunHighGrayLevelEmphasis gclm −1.93E+02 −3.29E+02 −5.60E+01 2.23E−03 **
RunEntropy gclm −6.67E−01 −9.75E−01 −3.59E−01 1.38E−06 ****
RunPercentage gclm 8.73E−02 8.15E−03 1.66E−01 2.48E−02 *
ShortRunLowGrayLevelEmphasis gclm 5.01E−02 1.36E−02 8.66E−02 3.03E−03 **
SizeZoneNonUniformity gclm −4.48E+00 −7.53E+00 −1.42E+00 1.37E−03 **
SmallAreaEmphasis gclm −9.51E−02 −1.77E−01 −1.34E−02 1.60E−02 *
ZoneEntropy gclm −7.79E−01 −1.29E+00 −2.67E−01 8.38E−04 ***
Coarseness gclm 1.04E−01 2.61E−02 1.81E−01 4.12E−03 **
Notes: (i) Parathyroid group is the reference group for all comparisons in the table.
(ii) Positive values indicate that the mean of the parathyroid group is lower and vice versa.
(iii) ns: Not significant; *0.01<P < 0.05; **0.001<P < 0.01; ***0.0001<P < 0.001; ****P<0.0001.
DOI: https://doi.org/10.36922/jctr.23.00112