
Page 80 - JCTR-10-2
P. 80
174 Kikuchi et al. | Journal of Clinical and Translational Research 2024; 10(2): 172-179
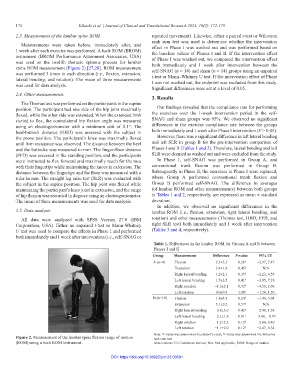
2.3. Measurement of the lumbar spine ROM repeated movement). Likewise, either a paired t-test or Wilcoxon
rank sum test was used to determine whether the intervention
Measurements were taken before, immediately after, and effect in Phase I was washed out and was performed based on
1 week after each exercise was performed. A back ROM (BROM) the baseline values of Phases I and II. If the intervention effect
instrument (BROM Performance Attainment Associates, USA) of Phase I was washed out, we compared the intervention effect
was used on the twelfth thoracic spinous process for lumbar both immediately and 1 week after intervention between the
spine ROM measurement (Figure 2) [27,28]. ROM measurement self-SNAG (n = 14) and sham (n = 14) groups using an unpaired
was performed 3 times in each direction (i.e., flexion, extension, t-test or Mann–Whitney U test. If the intervention effect of Phase
lateral bending, and rotation). The mean of three measurements I was not washed out, the endpoint was excluded from this study.
was used for data analysis.
Significant differences were set at a level of 0.05.
2.4. Other measurements
3. Results
The Thomas test was performed on the participants in the supine
position. The participant had one side of the hip joint maximally Our findings revealed that the compliance rate for performing
flexed, while the other side was extended. When the extended limb the exercises over the 1-week intervention period in the self-
started to flex, the contralateral hip flexion angle was measured SNAG and sham groups was 95%. We observed no significant
using an electrogoniometer with a minimum unit of 0.1°. The differences in the exercise compliance rate between the groups
heal-buttock distance (HBD) was assessed with the subject in both immediately and 1 week after Phase I intervention (P > 0.05).
the prone position. The participant’s knee was maximally flexed However, there was a significant difference in left lateral bending
until firm resistance was observed. The distance between the heel and left SLR in group B for the pre-intervention comparison of
and the buttocks was measured in mm. The finger-floor distance Phases I and II (Tables 1 and 2). Therefore, lateral bending and left
(FFD) was assessed in the standing position, and the participants SLR were deemed as washed out and were excluded from the study.
were instructed to flex forward and maximally reach for the toes In Phase I, self-SNAG was performed in Group A, and
with their fingertips while maintaining the knees in extension. The conventional trunk flexion was performed in Group B.
distance between the fingertips and the floor was measured with a Subsequently in Phase II, the exercises in Phase I were replaced,
ruler in mm. The straight leg raise test (SLR) was evaluated with where Group A performed conventional trunk flexion and
the subject in the supine position. The hip joint was flexed while Group B performed self-SNAG. The difference in averages
maintaining the participant’s knee joint in extension, and the range (of lumbar ROM and other measurements) between both groups
of hip flexion was recorded in degrees using an electrogoniometer. in Tables 1 and 2, respectively, are expressed as mean ± standard
The mean of three measurements was used for data analysis. deviation.
In addition, we observed no significant differences in the
2.5. Data analysis lumbar ROM (i.e., flexion, extension, right lateral bending, and
All data were analyzed with SPSS Version 27.0 (IBM rotation) and other measurements (Thomas test, HBD, FFD, and
Corporation, USA). Either an unpaired t-test or Mann-Whitney right SLR test) both immediately and 1 week after intervention
U test was used to compare the effects in Phase I and performed (Tables 3 and 4, respectively).
both immediately and 1 week after intervention (i.e., self-SNAG or
Table 1. Differences in the lumbar ROM for Groups A and B between
Phases I and II
Group Measurement Difference P‑value 95% CI
A (n=4) Flexion 2.3±3.3 0.26 † −2.97, 7.47
Extension 2.4±1.8 0.45 ‡ N/A
Right lateral bending 1.2±2.1 0.35 † −2.23, 4.56
Left lateral bending 1.7±3.5 0.41 † −3.85, 7.18
Right rotation −1.3±2.1 0.32 † −4.56, 2.06
Left rotation 0.0±0.9 1.00 † −1.50, 1.50
B (n=10) Flexion 1.8±4.5 0.24 † −1.44, 5.04
Extension 3.1±0.2 0.57 ‡ N/A
Right lateral bending −0.8±3.0 0.43 † −2.98, 1.38
Left lateral bending −2.1±1.8 0.01 † −3.48, −0.79
Right rotation −1.2±2.2 0.12 † −2.80, 0.40
Left rotation −1.1±2.0 0.12 † −2.47, 0.34
‡
Note: P-value was determined via student’s t-test; P-value was determined via Wilcoxon
†
Figure 2. Measurement of the lumbar spine flexion range of motion rank sum test.
(ROM) using a back ROM instrument. Abbreviations: CI: Confidence interval; N/A: Not applicable; ROM: Range of motion.
DOI: https://doi.org/10.36922/jctr.23.00091