
Page 74 - JCTR-10-2
P. 74
168 Ezenekwe et al. | Journal of Clinical and Translational Research 2024; 10(2): 165-171
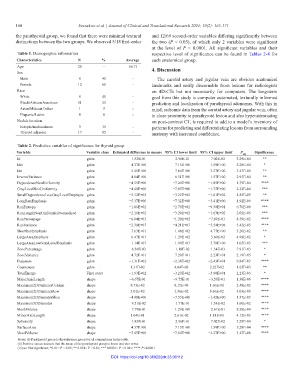
the parathyroid group, we found that there were minimal textural and 12/69 second-order variables differing significantly between
distinctions between the two groups. We observed 5/18 first-order the two (P < 0.05), of which only 2 variables were significant
at the level of P < 0.0001. All significant variables and their
Table 1. Demographic information respective level of significance can be found in Tables 2-4 for
Characteristics N % Average each anatomical group.
Age 20 - 56.71 4. Discussion
Sex
Male 8 40 - The carotid artery and jugular vein are obvious anatomical
Female 12 60 - landmarks and easily discernable from lesions for radiologists
Race on 4D-CTs but not necessarily for computers. The long-term
White 8 40 - goal from this study is computer automated, texturally informed
Black/African American 11 55 - prediction and localization of parathyroid adenomas. With this in
Asian/Mideast Indian 1 5 - mind, radiomic data from the carotid artery and jugular vein, often
Hispanic/Latinx 0 0 - in close proximity to parathyroid lesion and also hyperattenuating
Nodule location on post-contrast CT, is required to add to a model’s inventory of
Ectopic/mediastinum 3 15 - patterns for predicting and differentiating lesions from surrounding
Thyroid adjacent 17 85 - anatomy with increased confidence.
Table 2. Predictive variables of significance for thyroid group
Variable Variable class Estimated difference in means 95% CI lower limit 95% CI upper limit P Significance
adj
Id gclm −1.83E-01 −2.96E-01 −7.02E-02 3.29E-04 **
Idm gclm −4.37E+00 −7.15E+00 −1.59E+00 5.28E-04 *
Idn gclm −5.45E+00 −7.64E+00 −3.27E+00 3.47E-08 **
InverseVariance gclm −4.04E+00 −6.51E+00 −1.57E+00 2.95E-04 **
DependenceNonUniformity gclm −4.55E+00 −7.24E+00 −1.85E+00 1.79E-04 ****
GrayLevelNonUniformity gclm −4.40E+00 −7.05E+00 −1.75E+00 2.32E-04 ***
SmallDependenceLowGrayLevelEmphasis gclm −2.12E+02 −3.22E+02 −1.01E+02 1.82E-05 **
LongRunEmphasis gclm −5.37E+00 −7.32E+00 −3.41E+00 1.92E-09 ****
RunEntropy gclm −1.86E+02 −2.79E+02 −9.38E+01 6.76E-06 ***
RunLengthNonUniformityNormalized gclm −2.16E+02 −3.29E+02 −1.03E+02 2.05E-05 ***
RunPercentage gclm −6.04E+01 −1.20E+02 −7.89E-01 4.59E-02 ****
RunVariance gclm −2.38E+07 −4.21E+07 −5.54E+06 5.42E-03 ****
ShortRunEmphasis gclm −7.63E+01 −1.48E+02 −4.77E+00 3.20E-02 **
LargeAreaEmphasis gclm −6.47E+01 −1.29E+02 −3.60E-02 4.98E-02 *
LargeAreaLowGrayLevelEmphasis gclm −1.14E+07 −1.90E+07 −3.78E+06 1.05E-03 ***
ZonePercentage gclm −6.56E-03 −1.18E-02 −1.34E-03 7.91E-03 *
ZoneVariance gclm −4.72E+01 −7.20E+01 −2.23E+01 2.19E-05 *
Busyness gclm −1.31E+02 −2.38E+02 −2.43E+01 9.84E-03 ****
Coarseness gclm 1.31E-02 4.04E-03 2.22E-02 1.65E-03 **
TotalEnergy First order −1.93E+02 −3.29E+02 −5.60E+01 2.23E-03 *
MajorAxisLength shape −6.67E-01 −9.75E-01 −3.59E-01 1.38E-06 ****
Maximum2DDiameterColumn shape 8.73E-02 8.15E-03 1.66E-01 2.48E-02 ****
Maximum2DDiameterRow shape 5.01E-02 1.36E-02 8.66E-02 3.03E-03 ****
Maximum2DDiameterSlice shape −4.48E+00 −7.53E+00 −1.42E+00 1.37E-03 ****
Maximum3DDiameter shape −9.51E-02 −1.77E-01 −1.34E-02 1.60E-02 ****
MeshVolume shape −7.79E-01 −1.29E+00 −2.67E-01 8.38E-04 ****
MinorAxisLength shape 1.04E-01 2.61E-02 1.81E-01 4.12E-03 ****
Sphericity shape −1.83E-01 −2.96E-01 −7.02E-02 3.29E-04 *
SurfaceArea shape −4.37E+00 −7.15E+00 −1.59E+00 5.28E-04 ****
VoxelVolume shape −5.45E+00 −7.64E+00 −3.27E+00 3.47E-08 ****
Notes: (i) Parathyroid group is the reference group for all comparisons in the table.
(ii) Positive values indicate that the mean of the parathyroid group is lower and vice versa.
(iii) ns: Not significant; *0.01< P < 0.05; ** 0.001< P < 0.01; *** 0.0001< P < 0.001; **** P<0.0001.
DOI: https://doi.org/10.36922/jctr.23.00112