
Page 27 - JCTR-10-6
P. 27
Cordeiro et al.ǀ Journal of Clinical and Translational Research 2024; 10(6): 334-342 337
with a difference of 56 m between the groups. This sample Significant differences were observed in F O and the
2
I
allowed for a statistical power of 10% (alpha = 5%). PaO /F O ratio. Post-intervention, the F O in the NIVC and
I
2
2
2
I
NIVI groups were 0.43 ± 0.07 and 0.30 ± 0.10, respectively
2.8. Statistical analysis
(p = 0.01). One day later, the F O for the NIVC group was 0.40
I
2
Data analysis was conducted using the Statistical Package for ± 0.09, compared to 0.30 ± 0.05 in the NIVI group (p = 0.04).
the Social Sciences (SPSS) version 20.0 (IBM, USA). Normality The PaO /F O ratio in the NIVI group was significantly higher
2
I
2
was assessed using the Shapiro–Wilk test. Categorical variables at 75 (95% confidence interval [CI]: 45 – 91) immediately after
were analyzed using the Chi-square test, while continuous data NIV and 69 (95%CI: 33 to 82) one day later. Additional values
were expressed as the mean ± standard deviation. To evaluate are presented in Table 2.
oxygenation, functional capacity, and length of stay – both Table 3 displays the functional outcomes between the studied
intra- and intergroup – paired Student’s t-test and independent groups at various time points during the research. The FIM and
t-test were employed, respectively. Pulmonary complications MRC scores did not display statistically significant variation when
and mortality were assessed using the Chi-square test. A p-value comparing the groups at pre-operative assessment and hospital
of < 0.05 was considered statistically significant. discharge. However, a significant reduction was noted when
analyzing pre-operative scores compared to ICU discharge. The
3. Results NIVI group demonstrated better performance on 6MWT, with a
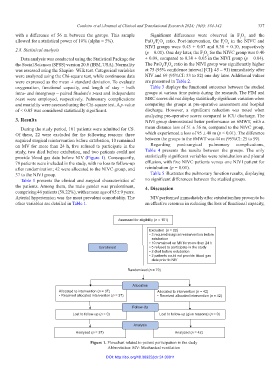
During the study period, 101 patients were admitted for CS. mean distance loss of 51 ± 36 m, compared to the NIVC group,
Of these, 22 were excluded for the following reasons: three which experienced a loss of 95 ± 40 m (p < 0.01). The difference
required surgical reintervention before extubation, 10 remained between the groups in the 6MWT was 44 m (95%CI: 25 to 59).
on MV for more than 24 h, five refused to participate in the Regarding post-surgical pulmonary complications,
study, two died before extubation, and two patients could not Table 4 presents the results between the groups. The only
provide blood gas data before NIV (Figure 1). Consequently, statistically significant variables were reintubation and pleural
79 patients were included in the study, with no loss to follow-up effusion, with five NIVC patients versus one NIVI patient for
after randomization; 42 were allocated to the NIVC group, and reintubation (p = 0.01).
37 to the NIVI group. Table 5 illustrates the pulmonary function results, displaying
Table 1 presents the clinical and surgical characteristics of no significant differences between the studied groups.
the patients. Among them, the male gender was predominant, 4. Discussion
comprising 46 patients (58.22%), with a mean age of 65 ± 9 years.
Arterial hypertension was the most prevalent comorbidity. The NIV performed immediately after extubation has proven to be
other variables are detailed in Table 1. an effective resource in reducing the loss of functional capacity,
Assessed for eligibility (n = 101)
Excluded (n = 22)
• 3 required surgical reintervention before
extubation
• 10 remained on MV for more than 24 h
Enrollment • 5 refused to participate in the study
• 2 died before extubation
• 2 patients could not provide blood gas
data prior to NIV
Randomized (n = 79)
Allocation
Allocated to intervention (n = 37) Allocated to intervention (n = 42)
• Received allocated intervention (n = 37) • Received allocated intervention (n = 42)
Follow-Up
Lost to follow-up (n = 0) Lost to follow-up (give reasons) (n = 0)
Analysis
Analyzed (n = 37) Analyzed (n = 42)
Figure 1. Flowchart related to patient participation in the study
Abbreviation: MV: Mechanical ventilation
DOI: http://doi.org/10.36922/jctr.24.00011