
Page 28 - JCTR-10-6
P. 28
338 Cordeiro et al.ǀ Journal of Clinical and Translational Research 2024; 10(6): 334-342
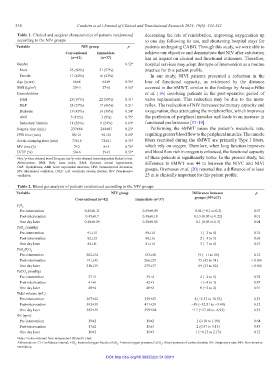
Table 1. Clinical and surgical characteristics of patients randomized decreasing the rate of reintubation, improving oxygenation up
according to the NIV groups to one day following its use, and shortening hospital stays for
Variable NIV group p patients undergoing CABG. Through this study, we were able to
Conventional Immediate achieve our objective and demonstrate that NIV after extubation
(n=42) (n=37) has an impact on clinical and functional outcomes. Therefore,
Gender 0.52 a hospital services may adopt this type of intervention as a routine
Male 25 (60%) 21 (57%) practice for this patient profile.
Female 17 (40%) 16 (43%) In our study, NIVI patients presented a reduction in the
Age (years) 66±8 64±9 0.36 b loss of functional capacity, as evidenced by the distance
BMI (kg/m²) 25±3 27±4 0.14 b covered in the 6MWT, similar to the findings by Araújo-Filho
Comorbidities et al. [16] involving patients in the post-operative period of
SAH 28 (67%) 22 (59%) 0.31 a valve replacement. This reduction may be due to the meta-
DLP 24 (57%) 17 (46%) 0.21 a reflex. The realization of NIV increases pulmonary capacity and
Diabetes 19 (45%) 14 (38%) 0.54 a oxygenation, thus attenuating the metaboreflex, which improves
AMI 5 (12%) 3 (8%) 0.75 a the perfusion of peripheral muscles and leads to an increase in
Sedentary lifestyle 11 (26%) 9 (24%) 0.69 a functional performance [17-19].
Surgery time (min) 237±88 244±87 0.23 b Performing the 6MWT raises the patient’s metabolic rate,
CPB time (min) 88±21 92±25 0.18 b requiring greater blood flow to the peripheral muscles. The muscle
Aortic clamping time (min) 77±18 72±21 0.35 b fibers recruited during the 6MWT are primarily Type I fibers,
MV time (h) 7±2 8±3 0.76 b which rely on oxygen. Therefore, when lung function improves
LVEF (%) 58±6 59±5 0.59 b and blood flow rich in oxygen is enhanced, the functional capacity
a
Note: p-value obtained from Chi-square test; p-value obtained from independent Student’s t-test. of these patients is significantly better. In the present study, the
b
Abbreviations: BMI: Body mass index; SAH: Systemic arterial hypertension; difference in 6MWT was 44 m between the NIVC and NIVI
DLP: Dyslipidemia; AMI: Acute myocardial infarction; CPB: Extracorporeal circulation; groups. Gremeaux et al. [20] reported that a difference of at least
MV: Mechanical ventilation; LVEF: Left ventricular ejection fraction; NIV: Non-invasive
ventilation. 25 m is clinically important for this patient profile.
Table 2. Blood gas analysis of patients randomized according to the NIV groups
Variable NIV group Difference between p
Conventional (n=42) Immediate (n=37) groups (95%CI)
F O 2
I
Pre-intervention 0.45±0.11 0.49±0.09 0.04 (−0.1 to 0.2) 0.67
Post-intervention 0.43±0.7 0.30±0.10 0.13 (0.05 to 0.22) 0.01
One day later 0.40±0.09 0.30±0.05 0.1 (0.03 to 0.3) 0.04
PaO (mmHg)
2
Pre-intervention 91±15 90±14 1 (−3 to 4) 0.76
Post-intervention 82±12 80±16 2 (−4 to 5) 0.68
One day later 84±11 81±14 3 (−7 to 8) 0.67
PaO /F O
2 I 2
Pre-intervention 202±34 183±48 19 (−11 to 28) 0.12
Post-intervention 191±45 266±29 75 (45 to 91) < 0.001
One day later 210±39 279±37 69 (33 to 82) < 0.001
PaCO (mmHg)
2
Pre-intervention 37±5 39±4 2 (−4 to 5) 0.78
Post-intervention 41±6 42±3 1 (−4 to 3) 0.87
One day later 40±4 40±2 0 (−2 to 2) 0.91
Tidal volume (mL)
Pre-intervention 367±22 359±25 8 (−2.53 to 18.53) 0.53
Post-intervention 392±31 411±29 −19 (−32.51 to −5.49) 0.32
One day later 382±21 399±24 −17 (−27.08 to -6.92) 0.39
RR (rpm)
Pre-intervention 19±2 18±2 1 (0.10 to 1.90) 0.64
Post-intervention 17±2 15±3 2 (0.87 to 3.13) 0.43
One day later 16±2 15±3 1 (−0.13 to 2.13) 0.72
Note:P-value obtained from independent Student’s t-test.
Abbreviations: CI: Confidence interval; FIO : Inspired oxygen fraction; PaO : Arterial oxygen pressure; PaCO : Blood pressure of carbon dioxide; RR: Respiratory rate; NIV: Non-invasive
2
2
2
ventilation.
DOI: http://doi.org/10.36922/jctr.24.00011