
Page 98 - JCTR-11-3
P. 98
Journal of Clinical and
Translational Research Household arsenic and bladder cancer
arsenic was positively correlated with urinary iAs across
all subjects (r = 0.41; p=0.004; Figure 3B). There was no
significant difference in household dust arsenic between
households reporting moderate-to-heavy traffic versus
minimal traffic (p=0.86, data not shown).
Concentrations of arsenic in drinking water ranged
from <0.04 to 5.05 μg/L, with no significant difference
between case (median: 0.135 μg/L) and control households
(median: 0.123 μg/L; p=0.61; Figure 4). Arsenic in
drinking water did not correlate with iAs across all subjects
(r = −0.24, p=0.28).
3.5. Urine cotinine
Three UCC patients and two controls had detectable
cotinine levels in their urine, ranging from 2 to 5,473 ng/mg
creatinine. Of these five individuals, four were former
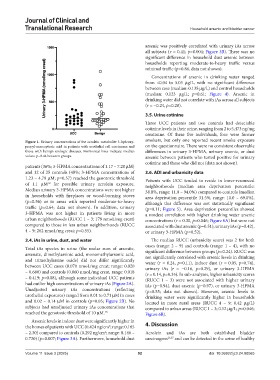
Figure 1. Urinary concentrations of the acrolein metabolite 3-hydroxy- smokers, but only one reported recent smoke exposure
propyl-mercapturic acid in patients with urothelial cell carcinoma and on the questionnaire. There were no consistent observable
those with benign urologic diseases. Horizontal lines indicate median differences in urinary 3-HPMA, urinary arsenic, or dust
values. p=0.44 between groups. arsenic between patients who tested positive for urinary
cotinine and those who did not (data not shown).
patients (36%; 3-HPMA concentrations of 1.17 – 7.20 μM)
and 12 of 25 controls (48%; 3-HPMA concentrations of 3.6. ADI and urbanicity data
1.23 – 4.79 μM; p=0.57) reached the genotoxic threshold Patients with UCC tended to reside in lower-resourced
of 1.1 μM for possible urinary acrolein exposure. neighborhoods (median area deprivation percentile:
18
Median urinary 3-HPMA concentrations were not higher 38.0%, range: 11.0 – 94.0%) compared to controls (median
in households with fireplaces or wood-burning stoves area deprivation percentile 31.5%, range: 10.0 – 69.0%),
(p=0.56) or in areas with reported moderate-to-heavy although this difference was not statistically significant
traffic (p=0.64; data not shown). In addition, urinary (p=0.11; Figure 5). Area deprivation percentiles showed
3-HPMA was not higher in patients living in more a modest correlation with higher drinking water arsenic
urban neighborhoods (RUCC 1 – 3; 179 nmoL/mg creat) concentrations (r = 0.30, p=0.046; Figure 6A) but were not
compared to those in less urban neighborhoods (RUCC associated with dust arsenic (p=0.51), urinary iAs (p=0.42),
4 – 9; 262 nmoL/mg creat; p=0.55). or urinary 3-HPMA (p=0.52).
3.4. iAs in urine, dust, and water The median RUCC (urbanicity score) was 2 for both
cases (range: 2 – 9) and controls (range: 1 – 4), with no
Total iAs species in urine (the molar sum of arsenite,
arsenate, dimethylarsinic acid, monomethylarsonic acid, significant difference between groups (p=0.24). RUCC was
not significantly correlated with arsenic levels in drinking
and trimethylarsine oxide) did not differ significantly water (r = 0.24, p=0.11), indoor dust (r = 0.05, p=0.74),
between UCC cases (0.070 nmoL/mg creat; range: 0.020 urinary iAs (r = −0.16, p=0.29), or urinary 3-HPMA
– 0.680) and controls (0.060 nmoL/mg creat, range: 0.018 (r = 0.14, p=0.35). In sub-analyses, higher urbanicity scores
– 0.419; p=0.08), although some individual UCC patients (RUCC 1 – 3) were not associated with higher urinary
had outlier high concentrations of urinary iAs (Figure 2A). iAs (p=0.94), dust arsenic (p=0.97), or urinary 3-HPMA
Unadjusted urinary iAs concentrations (reflecting (p=0.55; data not shown). However, arsenic levels in
urothelial exposures) ranged from 0.01 to 0.71 μM in cases drinking water were significantly higher in households
and 0.02 – 0.14 μM in controls (p=0.05; Figure 2B). No located in more rural areas (RUCC 4 – 9; 0.42 μg/L)
subjects had unadjusted urinary iAs concentrations that compared to urban areas (RUCC 1 – 3; 0.12 μg/L; p=0.046;
reached the genotoxic threshold of 10 μM. 18 Figure 6B).
Arsenic levels in indoor dust were significantly higher in
the homes of patients with UCC (0.424 ng/cm ; range: 0.165 4. Discussion
2
– 2.30) compared to controls (0.292 ng/cm ; range: 0.146 – Acrolein and iAs are both established bladder
2
0.730) (p=0.007; Figure 3A). Furthermore, household dust carcinogens 26,27 and can be detected in the urine of healthy
Volume 11 Issue 3 (2025) 92 doi: 10.36922/jctr.24.00065