
Page 89 - JCTR-11-4
P. 89
Journal of Clinical and
Translational Research NADPH oxidase inhibition in a rodent stroke model
A
B C
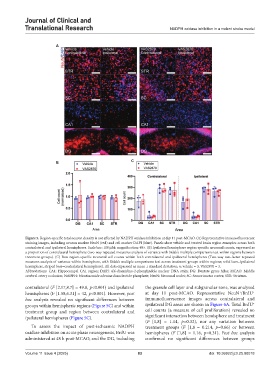
Figure 5. Region-specific total neuron density is not affected by NADPH oxidase inhibition at day 11 post-MCAO. (A) Representative immunofluorescent
staining images, including neuron marker NeuN (red) and cell marker DAPI (blue). Panels show vehicle and treated brain region examples across both
contralateral and ipsilateral hemispheres. Scale bar: 100 µM; magnification: 40×. (B) Ipsilateral hemisphere region-specific neuronal counts, expressed as
a proportion of contralateral hemisphere (two-way repeated measures analysis of variance with Sidak’s multiple comparisons test within regions between
treatment groups). (C) Raw region-specific neuronal cell counts within both contralateral and ipsilateral hemispheres (Two-way two-factor repeated
measures analysis of variance within hemisphere, with Sidak’s multiple comparisons test across treatment groups within regions; solid bars=ipsilateral
hemisphere, striped bars=contralateral hemisphere). All data expressed as mean ± standard deviation; n: vehicle = 3, VAS2870 = 3.
Abbreviations: CA1: Hippocampal CA1 region; DAPI: 4’,6-diamidino-2-phenylindole nuclear DNA stain; DG: Dentate gyrus hilus; MCAO: Middle
cerebral artery occlusion; NADPH: Nicotinamide adenine dinucleotide phosphate; NeuN: Neuronal nuclei; SC: Sensorimotor cortex; STR: Striatum.
contralateral (F [2.17,8.7] = 49.8, p<0.001) and ipsilateral the granule cell layer and subgranular zone, was analysed
+
hemispheres (F [1.58,6.31] = 42, p<0.001). However, post at day 11 post-MCAO. Representative NeuN /BrdU
+
hoc analysis revealed no significant differences between immunofluorescence images across contralateral and
+
groups within hemispheric regions (Figure 5C) and within ipsilateral DG areas are shown in Figure 6A. Total BrdU
treatment group and region between contralateral and cell counts (a measure of cell proliferation) revealed no
ipsilateral hemispheres (Figure 5C). significant interaction between hemisphere and treatment
(F [1,8] = 1.14, p=0.32), nor any variation between
To assess the impact of post-ischaemic NADPH treatment groups (F [1,8 = 0.214, p=0.66) or between
oxidase inhibition on acute phase neurogenesis, BrdU was hemispheres (F [1,8] = 1.16, p=0.31). Post hoc analysis
administered at 48 h post-MCAO, and the DG, including confirmed no significant differences between groups
Volume 11 Issue 4 (2025) 83 doi: 10.36922/jctr.25.00018