
Page 21 - JCTR-9-6
P. 21
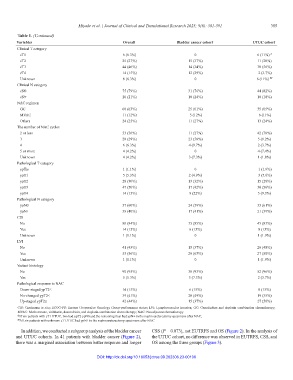
Miyake et al. | Journal of Clinical and Translational Research 2023; 9(6): 381-391   385
        Table 1. (Continued)
        Variables                                   Overall                Bladder cancer cohort           UTUC cohort
        Clinical T category
         cT1                                        6 (6.3%)                      0                         6 (11%)  #
         cT2                                        25 (27%)                    15 (37%)                     11 (20%)
         cT3                                        44 (46%)                    14 (34%)                    30 (56%)
         cT4                                        14 (15%)                    12 (29%)                     2 (3.7%)
         Unknown                                    6 (6.3%)                      0                         6 (11%)  ##
        Clinical N category
         cN0                                        75 (79%)                    31 (76%)                    44 (82%)
         cN+                                        20 (21%)                    10 (24%)                    10 (18%)
        NAC regimen
         GC                                         60 (63%)                    25 (61%)                    35 (65%)
         MVAC                                       11 (12%)                     5 (12%)                      6 (11%)
         Others                                     24 (25%)                    11 (27%)                    13 (24%)
        The number of NAC cycles
         2 or less                                  53 (56%)                    11 (27%)                    42 (78%)
         3                                          28 (29%)                    23 (56%)                     5 (9.2%)
         4                                          6 (6.3%)                    4 (9.7%)                     2 (3.7%)
         5 or more                                  4 (4.2%)                      0                          4 (7.4%)
         Unknown                                    4 (4.2%)                    3 (7.3%)                     1 (1.8%)
        Pathological T category
         ypTis                                      1 (1.1%)                      0                          1 (1.9%)
         ypT1                                       5 (5.3%)                    2 (4.9%)                     3 (5.6%)
         ypT2                                       28 (30%)                    13 (32%)                    15 (28%)
         ypT3                                       47 (50%)                    17 (42%)                    30 (56%)
         ypT4                                       14 (15%)                    9 (22%)                      5 (9.3%)
        Pathological N category
         ypN0                                       57 (60%)                    24 (59%)                    33 (61%)
         ypN+                                       38 (40%)                    17 (41%)                    21 (39%)
        CIS
         No                                         80 (84%)                    35 (85%)                    45 (83%)
         Yes                                        14 (15%)                    6 (15%)                      8 (15%)
         Unknown                                    1 (1.1%)                      0                          1 (1.9%)
        LVI
         No                                         41 (43%)                    15 (37%)                    26 (48%)
         Yes                                        53 (56%)                    26 (63%)                    27 (50%)
         Unknown                                    1 (1.1%)                      0                          1 (1.9%)
        Variant histology
         No                                         90 (95%)                    38 (93%)                    52 (96%)
         Yes                                        5 (5.3%)                    3 (7.3%)                     2 (3.7%)
        Pathological response to NAC
         Down-staged ypT2≤                          14 (15%)                    6 (15%)                      8 (15%)
         No-changed ypT2≤                           39 (41%)                    20 (49%)                    19 (35%)
         Up-staged ypT2≤                            42 (44%)                    15 (37%)                    27 (50%)
        CIS: Carcinoma in situ; ECOG-PS: Eastern Cooperative Oncology Group-performance status; LVI: Lymphovascular invasion; GC: Gemcitabine and cisplatin combination chemotherapy;
        MVAC: Methotrexate, vinblastin, doxorubicin, and cisplatin combination chemotherapy; NAC: Neoadjuvant chemotherapy.
        # Of six patients with cT1 UTUC, two had ypT2 ypN0 and the remaining four had ypN+ in the nephroureterectomy specimens after NAC;
        ## All six patients with unknown cT UTUC had ypN+ in the nephroureterectomy specimens after NAC
          In addition, we conducted a subgroup analysis of the bladder cancer   CSS (P = 0.073), not EUTRFS and OS (Figure 2). In the analysis of
        and UTUC cohorts. In 41 patients with bladder cancer (Figure 2),   the UTUC cohort, no difference was observed in EUTRFS, CSS, and
        there was a marginal association between better response and longer   OS among the three groups (Figure 3).


                                          DOI: http://dx.doi.org/10.18053/jctres.09.202306.23-00106