Page 22 - JCTR-9-6
P. 22

386                       Miyake et al. | Journal of Clinical and Translational Research 2023; 9(6): 381-391
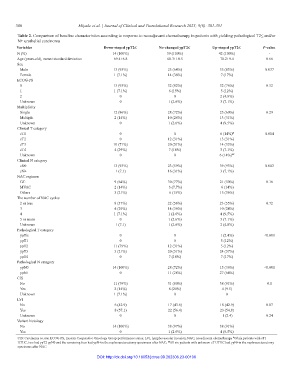
        Table 2. Comparison of baseline characteristics according to response to neoadjuvant chemotherapy in patients with yielding pathological T2≤ and/or
        N+ urothelial carcinoma
        Variables                           Down‑staged ypT2≤      No‑changed ypT2≤       Up‑staged ypT2≤      P‑value
        N (%)                                   14 (100%)              39 (100%)            42 (100%)            -
        Age (years-old), mean±standard deviation  69.4±6.8             68.3±10.5             70.2±9.4           0.66
        Sex
         Male                                   13 (93%)               25 (64%)              35 (83%)           0.037
         Female                                  1 (7.1%)              14 (36%)              7 (17%)
        ECOG-PS
         0                                      13 (93%)               32 (82%)              32 (76%)           0.52
         1                                       1 (7.1%)               6 (15%)              5 (12%)
         2                                         0                      0                  2 (4.8%)
         Unknown                                   0                   1 (2.6%)              3 (7.1%)
        Multiplicity
         Single                                 12 (86%)               28 (72%)              25 (60%)           0.29
         Multiple                                2 (14%)               10 (26%)              13 (31%)
         Unknown                                   0                   1 (2.6%)              4 (9.5%)
        Clinical T category
         cT1                                       0                      0                  6 (14%) #          0.004
         cT2                                       0                   12 (31%)              13 (31%)
         cT3                                    10 (71%)               20 (51%)              14 (33%)
         cT4                                     4 (29%)                7 (18%)              3 (7.1%)
         Unknown                                   0                      0                  6 (14%) ##
        Clinical N category
         cN0                                    13 (93%)               23 (59%)              39 (93%)           0.003
         cN+                                     1 (7.1)               16 (31%)              3 (7.1%)
        NAC regimen
         GC                                      9 (64%)               30 (77%)              21 (50%)           0.16
         MVAC                                    2 (14%)                3 (7.7%)              6 (14%)
         Others                                  3 (21%)                6 (15%)              15 (36%)
        The number of NAC cycles
         2 or less                               8 (57%)               22 (56%)              23 (55%)           0.72
         3                                       4 (29%)               14 (36%)              10 (24%)
         4                                       1 (7.1%)              1 (2.6%)              4 (9.5%)
         5 or more                                 0                   1 (2.6%)              3 (7.1%)
         Unknown                                 1 (7.1)               1 (2.6%)              2 (4.8%)
        Pathological T category
         ypTis                                     0                      0                  1 (2.4%)          <0.001
         ypT1                                      0                      0                  5 (12%)
         ypT2                                   11 (79%)               12 (31%)              5 (12%)
         ypT3                                    3 (21%)               20 (51%)              24 (57%)
         ypT4                                      0                    7 (18%)              7 (17%)
        Pathological N category
         ypN0                                   14 (100%)              28 (72%)              15 (36%)          <0.001
         ypN+                                      0                   11 (28%)              27 (64%)
        CIS
         No                                     11 (79%)               31 (80%)              38 (91%)            0.1
         Yes                                     2 (14%)                8 (20%)               4 (9.5)
         Unknown                                 1 (7.1%)                 0                    0
        LVI
         No                                      6 (42.9)              17 (43.6)             18 (42.9)          0.87
         Yes                                     8 (57.1)              22 (56.4)             23 (54.8)
         Unknown                                   0                      0                   1 (2.4)           0.24
        Variant histology
         No                                     14 (100%)              38 (97%)              38 (91%)
         Yes                                       0                   1 (2.6%)              4 (9.5%)
        CIS: Carcinoma in situ; ECOG-PS, Eastern Cooperative Oncology Group-performance status; LVI, lymphovascular invasion; NAC, neoadjuvant chemotherapy  Of six patients with cT1
                                                                                                  #
                                                                       ##
        UTUC, two had ypT2 ypN0 and the remaining four had ypN+in the nephroureterectomy specimens after NAC;  All six patients with unknown cT UTUC had ypN+in the nephroureterectomy
        specimens after NAC
                                          DOI: http://dx.doi.org/10.18053/jctres.09.202306.23-00106
   17   18   19   20   21   22   23   24   25   26   27