
Page 23 - JCTR-9-6
P. 23
Miyake et al. | Journal of Clinical and Translational Research 2023; 9(6): 381-391 387
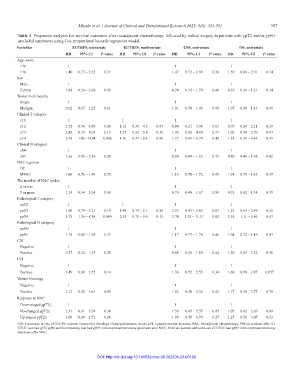
Table 3. Prognostic analyses for survival outcomes after neoadjuvant chemotherapy followed by radical surgery in patients with ypT2 and/or ypN+
urothelial carcinoma using Cox proportional hazards regression model.
Variables EUTRFS, univariate EUTRFS, multivariate CSS, univariate OS, univariate
HR 95% CI P‑value HR 95% CI P‑value HR 95% CI P‑value HR 95% CI P‑value
Age, years
<70 1 1 1
≥70 1.40 0.77 – 2.53 0.27 1.47 0.73 – 2.99 0.28 1.59 0.86 – 2.91 0.14
Sex
Male 1 1 1
Female 1.04 0.54 – 2.00 0.92 0.74 0.32 – 1.70 0.48 0.56 0.26 – 1.21 0.14
Tumor multifocality
Single 1 1 1
Multiple 0.92 0.67 – 1.27 0.61 1.01 0.70 – 1.46 0.95 1.07 0.80 – 1.43 0.65
Clinical T category
cT1 1 1 1 1
cT2 1.32 0.36 – 4.89 0.68 1.12 0.30 – 4.2 0.87 0.84 0.21 – 3.38 0.81 0.70 0.24 – 2.11 0.53
cT3 2.42 0.73 – 8.05 0.15 1.73 0.52 – 5.8 0.38 1.43 0.42 – 4.89 0.57 1.02 0.38 – 2.70 0.97
cT4 3.78 1.03 – 13.94 0.046 1.76 0.37 – 8.4 0.48 1.75 0.45 – 6.78 0.42 1.51 0.51 – 4.43 0.45
Clinical N category
cN0 1 1 1
cN+ 1.36 0.85 – 2.16 0.20 0.90 0.49 – 1.65 0.73 0.80 0.46 – 1.38 0.42
NAC regimen
GC 1 1 1
MVAC 1.06 0.76 – 1.49 0.72 1.16 0.78 – 1.72 0.45 1.01 0.71 – 1.43 0.97
The number of NAC cycles
2 or less 1 1 1
3 or more 1.14 0.64 – 2.04 0.65 0.79 0.40 – 1.57 0.50 0.75 0.42 – 1.34 0.33
Pathological T category
ypT2 1 1 1 1
ypT3 1.60 0.79 – 3.21 0.19 1.49 0.73 – 3.1 0.28 2.35 0.95 – 5.85 0.07 1.25 0.63 – 2.49 0.52
ypT4 3.33 1.36 – 8.18 0.009 2.53 0.71 – 9.0 0.15 3.74 1.25 – 11.17 0.02 2.55 1.11 – 5.86 0.03
Pathological N category
ypN0 1 1 1
ypN+ 1.18 0.82 – 1.69 0.37 1.17 0.77 – 1.76 0.46 1.04 0.72 – 1.49 0.83
CIS
Negative 1 1 1
Positive 0.57 0.24 – 1.35 0.20 0.68 0.26 – 1.80 0.44 1.20 0.65 – 2.22 0.56
LVI
Negative 1 1 1
Positive 1.49 0.88 – 2.52 0.14 1.36 0.72 – 2.55 0.34 1.68 0.98 – 2.87 0.057
Variant histology
Negative 1 1 1
Positive 1.12 0.35 – 3.61 0.85 1.63 0.50 – 5.36 0.42 1.17 0.36 – 3.77 0.79
Response to NAC
Down-staged ypT2≤ 1 1 1
No-changed ypT2≤ 1.51 0.61 – 3.74 0.38 1.59 0.45 – 5.57 0.47 1.07 0.42 – 2.69 0.89
Up-staged ypT2≤ 1.09 0.44 – 2.71 0.86 1.98 0.58 – 6.74 0.27 1.25 0.51 – 3.07 0.63
CIS: Carcinoma in situ; ECOG-PS: Eastern Cooperative Oncology Group-performance status; LVI: Lymphovascular invasion; NAC: Neoadjuvant chemotherapy, #Of six patients with cT1
UTUC, two had ypT2 ypN0 and the remaining four had ypN+ in the nephroureterectomy specimens after NAC; ##All six patietns with unknown cT UTUC had ypN+ in the nephroureterectomy
specimens after NAC.
DOI: http://dx.doi.org/10.18053/jctres.09.202306.23-00106