
Page 104 - MI-1-1
P. 104
Microbes & Immunity Factors associated with response to T-VEC
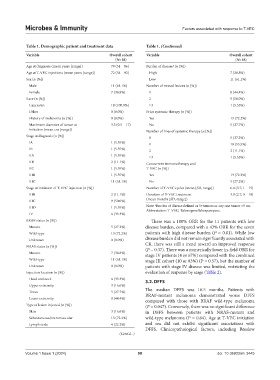
Table 1. Demographic patient and treatment data Table 1. (Continued)
Variable Overall cohort Variable Overall cohort
(N=18) (N=18)
Age at diagnosis (mean years [range]) 70 (51 – 86) Burden of disease (n [%])
a
Age at T-VEC injections (mean years [range]) 72 (54 – 92) High 7 (38.8%)
Sex (n [%]) Low 11 (61.1%)
Male 11 (61.1%) Number of treated lesions (n [%])
Female 7 (38.8%) 1 8 (44.4%)
Race (n [%]) 2 9 (50.0%)
Caucasian 18 (100.0%) ≥3 1 (5.55%)
Other 0 (0.0%) Prior systemic therapy (n [%])
History of melanoma (n [%]) 0 (0.0%) Yes 13 (72.2%)
Maximum diameter of tumor at 3.5 (0.5 – 17) No 5 (27.7%)
initiation (mean cm [range]) Number of lines of systemic therapy (n [%])
Stage at diagnosis (n [%]) 0 5 (27.2%)
IA 1 (5.55%) 1 10 (55.5%)
IB 1 (5.55%) 2 2 (11.1%)
IIA 1 (5.55%) ≥3 1 (5.55%)
IIB 2 (11.1%) Concurrent immunotherapy and
IIC 1 (5.55%) T-VEC (n [%])
IIIB 1 (5.55%) Yes 13 (72.2%)
IIIC 11 (61.1%) No 5 (27.2%)
Stage at initiation of T-VEC injection (n [%]) Number of T-VEC cycles (mean [SD, range]) 6.4 (3.7, 1 – 15)
IIIB 2 (11.1%) Duration of T-VEC treatment 3.9 (2.7, 0 – 10)
IIIC 9 (50.0%) (mean months [SD, range])
a
IIID 1 (5.55%) Note: Burden of disease defined as 5+tumors or any one tumor >5 cm.
Abbreviation: T-VEC: Talimogene laherparepvec.
IV 6 (33.3%)
BRAF status (n [%]) There was a 100% ORR for the 11 patients with low
Mutant 5 (27.2%) disease burden, compared with a 43% ORR for the seven
Wild-type 13 (72.2%) patients with high disease burden (P = 0.01). While low
Unknown 0 (0.0%) disease burden did not remain significantly associated with
NRAS status (n [%]) CR, there was still a trend toward an improved response
(P = 0.37). There was a numerically lower in-field ORR for
Mutant 7 (38.8%) stage IV patients (4 or 67%) compared with the combined
Wild-type 11 (61.1%) stage III cohort (10 or 83%) (P = 0.57), but the number of
Unknown 0 (0.0%) patients with stage IV disease was limited, restricting the
Injection location (n [%]) evaluation of response by stage (Table 2).
Head and neck 6 (33.3%) 3.2. DFFS
Upper extremity 3 (16.6%)
Torso 5 (27.7%) The median DFFS was 16.5 months. Patients with
BRAF-mutant melanoma demonstrated worse DFFS
Lower extremity 8 (44.4%) compared with those with BRAF wild-type melanoma
Type of lesion injected (n [%]) (P = 0.047). Conversely, there was no significant difference
Skin 3 (16.6%) in DFFS between patients with NRAS-mutant and
Subcutaneous/Intramuscular 13 (72.2%) wild-type melanoma (P = 0.64). Age at T-VEC initiation
Lymph node 4 (22.2%) and sex did not exhibit significant associations with
DFFS. Clinicopathological factors, including Breslow
(Cont'd...)
Volume 1 Issue 1 (2024) 98 doi: 10.36922/mi.3445