Page 106 - MI-1-1
P. 106

Microbes & Immunity                                                Factors associated with response to T-VEC


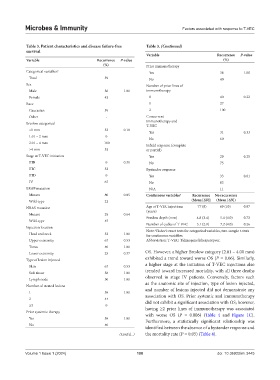
            Table 3. Patient characteristics and disease failure‑free   Table 3. (Continued)
            survival
                                                               Variable                      Recurrence   P‑value
            Variable                      Recurrence   P‑value                                  (%)
                                             (%)               Prior immunotherapy
            Categorical variables a                             Yes                               38     1.00
             Total                            39                No                                40
            Sex                                                Number of prior lines of
             Male                             36      1.00     immunotherapy
             Female                           43                0                                 40     0.22
            Race                                                1                                 27
             Caucasian                        39                2                                 100
             Other                            -                Concurrent
                                                               immunotherapy and
            Breslow categorical
                                                               T-VEC
             <1 mm                            33      0.18      Yes                               31     0.33
             1.01 – 2 mm                      0
                                                                No                                60
             2.01 – 4 mm                      100
                                                               Infield response (complete
             >4 mm                            33               or partial)
            Stage at T-VEC initiation                           Yes                               29     0.25
             IIIB                             0       0.31      No                                75
             IIIC                             33               Bystander response
             IIID                             0                 Yes                               33     0.01
             IV                               67                No                                83
            BRAF mutation                                       N/A                               11
             Mutant                           80      0.05     Continuous variables a  Recurrence   No recurrence
             Wild-type                        23                                  (Mean [SD])   (Mean [SD])
            NRAS mutation                                      Age at T-VEC injections    77 (8)        69 (10)  0.97
                                                               (years)
             Mutant                           29      0.64
                                                               Breslow depth (mm)      4.8 (3.4)  5.4 (4.0)  0.73
             Wild-type                        45
                                                               Number of cycles of T-VEC     5.1 (2.9)  7.2 (4.0)  0.26
            Injection location
                                                               Note:  Fisher’s exact tests for categorical variables, two-sample t-tests
                                                                   a
             Head and neck                    33      1.00     for continuous variables.
             Upper extremity                  67      0.53     Abbreviation: T-VEC: Talimogene laherparepvec.
             Torso                            40      1.00
             Lower extremity                  25      0.37     OS. However, a higher Breslow category (2.01 – 4.00 mm)
            Type of lesion injected                            exhibited a trend toward worse OS (P = 0.06). Similarly,
             Skin                             67      0.53     a higher stage at the initiation of T-VEC injections also
             Soft tissue                      38      1.00     trended toward increased mortality, with all three deaths
             Lymph node                       50      1.00     observed in stage IV patients. Conversely, factors such
            Number of treated lesions                          as the anatomic site of injection, type of lesion injected,
             1                                38      1.00     and number of lesions injected did not demonstrate any
                                                               association with OS. Prior systemic and immunotherapy
             2                                44               did not exhibit a significant association with OS; however,
             ≥3                               0                having ≥2 prior lines of immunotherapy was associated
            Prior systemic therapy                             with  worse  OS  (P  =  0.006)  (Table  4  and  Figure  1C).
             Yes                              38      1.00     Furthermore, a statistically significant relationship was
             No                               40
                                                               identified between the absence of a bystander response and
                                                    (Cont'd...)   the mortality rate (P = 0.05) (Table 4).


            Volume 1 Issue 1 (2024)                        100                               doi: 10.36922/mi.3445
   101   102   103   104   105   106   107   108   109   110   111