Page 105 - MI-1-1
P. 105

Microbes & Immunity                                                Factors associated with response to T-VEC


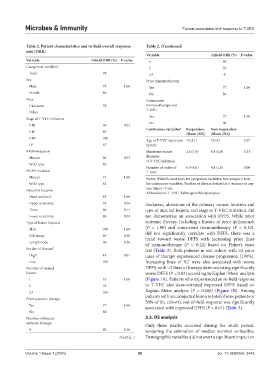
            Table 2. Patient characteristics and in‑field overall response   Table 2. (Continued)
            rate (ORR)
                                                               Variable                    Infield ORR (%)  P‑value
            Variable                    Infield ORR (%)  P‑value  1                             90
            Categorical variables a                             2                               50
             Total                           78                 ≥3                              0
            Sex                                                Prior immunotherapy
             Male                            73       1.00      Yes                             77       1.00
             Female                          86                 No                              80
            Race                                               Concurrent
             Caucasian                       78                immunotherapy and
                                                               T-VEC
             Other                           -
                                                                Yes                             77       1.00
            Stage at T-VEC initiation
                                                                No                              80
             IIIB                            50       0.52
             IIIC                            89                Continuous variables a  Responders   Non‑responders
                                                                                (Mean [SD])   (Mean [SD])
             IIID                            100
                                                               Age at T-VEC injections  72 (11)  72 (4)  0.97
             IV                              67                (years)
            BRAF mutation                                      Maximum tumor    2.6 (1.9)  6.8 (6.8)     0.31
             Mutant                          60       0.53     diameter
                                                               at T-VEC initiation
             Wild-type                       85
                                                               Number of cycles of   6.9 (4.0)  4.8 (1.0)  0.09
            NRAS mutation                                      T-VEC
             Mutant                          71       1.00     Notes:  Fisher’s exact tests for categorical variables, two-sample t-tests
                                                                    a
             Wild-type                       82                for continuous variables;  burden of disease defined as 5+tumors or any
                                                                               b
            Injection location                                 one tumor >5 cm.
                                                               Abbreviation: T-VEC: Talimogene laherparepvec.
             Head and neck                   83       1.00
             Upper extremity                 33       0.54     thickness, ulceration of the primary tumor, location and
             Torso                           60       0.11     type of injected lesions, and stage at T-VEC initiation, did
             Lower extremity                 88       0.59     not demonstrate an association with DFFS. While prior
            Type of lesion injected                            systemic therapy, including a history of prior ipilimumab
             Skin                            100      1.00     (P  = 1.00) and concurrent immunotherapy (P  = 0.33),
             Soft tissue                     69       0.28     did not significantly correlate with DFFS, there was a
                                                               trend toward worse DFFS with increasing prior lines
             Lymph node                      50       0.20     of immunotherapy (P  = 0.22) based on Fisher’s exact
            Burden of disease b                                test (Table 3). Both patients in our cohort with ≥2 prior
             High                            43       0.01     lines of therapy experienced disease progression (100%).
             Low                             100               Increasing lines of ICI were also associated with worse
            Number of treated                                  DFFS, with >2 lines of therapy demonstrating significantly
            lesions                                            worse DFFS (P = 0.02) according to Kaplan–Meier analysis
             1                               75       1.00     (Figure 1A). Patients who experienced an in-field response
             2                               78                to T-VEC also demonstrated improved DFFS based on
             ≥3                              100               Kaplan–Meier analysis (P  = 0.006) (Figure  1B). Among
            Prior systemic therapy                             patients with an uninjected lesion (a total of nine patients or
                                                               50% of the cohort), out-of-field response was significantly
             Yes                             77       1.00     associated with improved DFFS (P = 0.01) (Table 3).
             No                              80
            Number of lines of                                 3.3. OS analysis
            systemic therapy                                   Only three deaths occurred during the study period,
             0                               80       0.18     rendering the estimation of median survival unfeasible.
                                                    (Cont'd...)   Demographic variables did not exert a significant impact on


            Volume 1 Issue 1 (2024)                         99                               doi: 10.36922/mi.3445
   100   101   102   103   104   105   106   107   108   109   110