
Page 77 - MI-1-1
P. 77
Microbes & Immunity An ATP-free packaging of T4 DNA
equivalent to the counter length of total T4 DNA of stretched T4 DNA is ca. 50 μm long, and by means of
the entangled random coil conformation. 21-24 Totally fluorescent imaging, the fully stretched DNA appears
thinner and dimmer than the entangled DNA. Ca
24
2+
Table 1. Effects of phosphate and Ca ions on ejections of acts counteractively against Pi to suppress the ejection of
2+
DNAs from virions of T4 DNA. Mg was also counteractive against Pi, while the
2+
strength of suppression of ejection was weaker than Ca
2+
Phosphate Ca (mM) Mg (mM) (Table 1). Immersion in an cell-sap-mimicking electrolyte
2+
2+
(mM) 0 0.1 1 1 also induced the ejection of T4 DNA. The ejections of
100 +++ +++ +++ +++ DNA molecules from the capsids were confirmed by
10 +++ +++ + ++ assessing the degradation of specimens with DNase I in
1 ++ ++ - + EL or 30 mM Pi, relative to the degradation in original
0.1 + + - - suspensions. All the DNA molecules of T4 virions
0.01 - - - - immersed in 30 mM Pi were completely degraded by the
on-filter-dry DNase I treatment and no intact virion was
Notes: A higher Pi concentration and a lower Ca concentration detected (Figure 1E).
2+
resulted in the ejection of more DNA molecules from T4 heads. Pi and
Ca acted antagonistically on the ejection of DNA in vitro. More than To ascertain the compact conformation of T4 DNA in
2+
80% of virions ejected their DNA when the ambient concentration of the capsid in the low Pi concentration with coexistence
Pi was higher than 10 mM and that of Ca was lower than 0.1 mM. of divalent cations, the capsid proteins of T4 virions were
2+
Mg ion acted as a counteractive ion to Pi in the DNA ejection, while
2+
the effects were weaker than Ca . degraded with proteinase K in EL. The T4 DNA showed
2+
Rates of ejections: +++: >80%; ++: 20 – 80%; +: 5 – 20%; -: <5%. globules (Figure 2), not self-repulsive strings (Figure 1B).
A B C
D E F
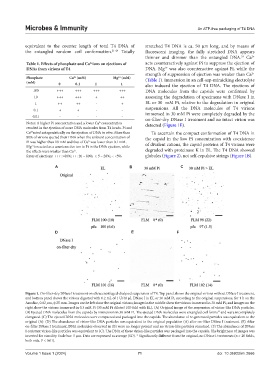
Figure 1. On-filter-dry DNase I treatment on ultracentrifuged-dialyzed suspension of T4. Top panel shows the original virions without DNase I treatment,
and bottom panel shows the virions digested with 0.2 mL of 1 U/40 μL DNase I in EL or 30 mM Pi, according to the original suspensions, for 1 h on the
Anodisc, 0.02 μm, φ 25 mm. Images on the left show the original virions; images in the middle show the virions immersed in 30 mM Pi; and images on the
right show the virions immersed in 0.3 mM Pi (30 mM Pi diluted 100-fold with EL). (A) Original image of the suspension of virion-like DNA particles.
(B) Ejected DNA molecules from the capsids by immersion in 30 mM Pi. The ejected DNA molecules were entangled coil forms and were incompletely
21
elongated. (C) The ejected DNA molecules were compacted and packaged into the capsids. The abundance of re-generated particles was equivalent to the
original (A). (D) The abundance of virion-like DNA particles was equivalent to the original population (A) after on-filter DNase I treatment. (E) After
on-filter DNase I treatment, DNA molecules observed in (B) were no longer present and no virion-like particles remained. (F) The abundance of DNase
I-resistant virion-like particles was equivalent to (C). The DNA of these virion-like particles was packaged into the capsids. The brightness of images was
inverted for visuality. Scale bar: 5 μm. Data are expressed as average (SD). * Significantly different from the original, no DNase I treatments (n > 20 fields,
both side, P < 0.01).
Volume 1 Issue 1 (2024) 71 doi: 10.36922/mi.2666