
Page 80 - MI-1-1
P. 80
Microbes & Immunity An ATP-free packaging of T4 DNA
A D G
B E H
C F
I
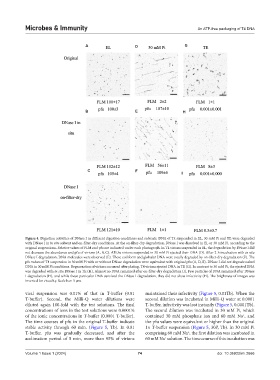
Figure 4. Digestion activities of DNase I in different digestion conditions and solvents. DNA of T4 suspended in EL, 30 mM Pi and TE were degraded
with DNase I in in situ solvent and on-filter-dry conditions. At the on-filter-dry degradation, DNase I was dissolved in EL or 30 mM Pi, according to the
original suspensions. Relative values of FLM and pfu are indicated under each photograph. In T4 virions suspended in EL, the degradation by DNase I did
not decrease the abundance and pfu of virions (A, B, C). All the virions suspended in 30 mM Pi ejected their DNA (D). After 2-h incubation with in situ
DNase I degradation, DNA molecules were observed (E). These coil form and globular DNA were totally degraded by on-filter-dry degradation (F). The
pfu values of T4 suspension in 30 mM Pi with or without DNase degradation were equivalent with original pfu (A, D, E). DNase I did not degrade naked
DNA in 30 mM Pi conditions. Regeneration of virions occurred after plating. T4 virions ejected DNA in TE (G). In contrast to 30 mM Pi, the ejected DNA
was degraded with in situ DNase I in TE (H). Almost no DNA remained after on-filter-dry degradation (I). Few particles of DNA remained after DNase
I degradation (H), and while these particular DNA survived the DNase I degradation, they did not show infectivity (H). The brightness of images was
inverted for visuality. Scale bar: 5 μm.
viral suspension was 0.01% of that in T-buffer (0.01 maintained their infectivity (Figure 5, 0.01Tb). When the
T-buffer). Second, the Milli-Q water dilutions were second dilution was incubated in Milli-Q water at 0.0001
diluted again 100-fold with the test solutions. The final T-buffer, infectivity was lost instantly (Figure 5, 0.0001Tb).
concentrations of ions in the test solutions were 0.0001% The second dilution was incubated in 30 mM Pi, which
of the ionic concentrations in T-buffer (0.0001 T-buffer). contained 30 mM phosphate ion and 60 mM Na , and
+
The time courses of pfu in the original T-buffer indicate the pfu values were equivalent or higher than the original
stable activity through 60 min. (Figure 5, Tb). In 0.01 1× T-buffer suspension (Figure 5, 30P, Tb). In 30 mM Pi
T-buffer, pfu was gradually decreased, and after the comprising 60 mM Na , the first dilution was incubated in
+
acclimation period of 5 min, more than 95% of virions 60 mM Na solution. The time course of this incubation was
+
Volume 1 Issue 1 (2024) 74 doi: 10.36922/mi.2666