Page 77 - MSAM-1-1
P. 77

Materials Science in Additive Manufacturing                                A ML model for AM PSP of Ti64


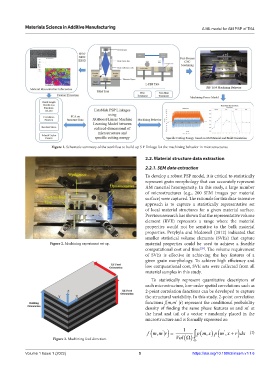
                       Figure 1. Schematic summary of the workflow to build-up S-P linkage for the machining behavior in microstructures.

                                                               2.2. Material structure data extraction

                                                               2.2.1. SEM data extraction
                                                               To develop a robust PSP model, it is critical to statistically
                                                               represent grain morphology that can accurately represent
                                                               AM material heterogeneity. In this study, a large number
                                                               of microstructures (e.g., 200 SEM images per material
                                                               surface) were captured. The rationale for this data-intensive
                                                               approach is to capture a statistically representative set
                                                               of local  material  structures for  a given  material  surface.
                                                               Previous research has shown that the representative volume
                                                               element (RVE) represents a range where the material
                                                               properties  would not  be  sensitive  to  the bulk material
                                                               properties. Przybyla and Mcdowell (2012) indicated that
                                                               smaller  statistical  volume elements (SVEs) that  capture
                      Figure 2. Machining experiment set up.   material properties  could  be  used  to achieve a  feasible
                                                               computational cost and time . The volume requirement
                                                                                      [29]
                                                               of SVEs is effective in achieving the key features of a
                                                               given grain morphology. To achieve high efficiency and
                                                               low computational cost, SVE sets were collected from all
                                                               material samples in this study.

                                                                 To statistically represent quantitative descriptors of
                                                               each microstructure, low-order spatial correlations such as
                                                               2-point correlation functions can be developed to capture
                                                               the structural variability. In this study, 2-point correlation
                                                               functions f(m,m’ |r) represent the conditional probability
                                                               density of finding the same phase features  m and  m’ at
                                                               the  head  and  tail  of  a  vector  r  randomly  placed  in  the
                                                               microstructure and is formally expressed as:

                                                                                                      )
                                                                                           ) (
                                                                        )
                                                                                                '
                                                                f (  , m m ' |r =  1  ∫  ( pm x pm x r dx   (I)
                                                                                         ,
                                                                                                 , +
                                                                               ( )
                        Figure 3. Machining feed direction.                 Vol Ω  Ω
            Volume 1 Issue 1 (2022)                         5                      https://doi.org/10.18063/msam.v1i1.6
   72   73   74   75   76   77   78   79   80   81   82