
Page 82 - MSAM-1-1
P. 82
Materials Science in Additive Manufacturing A ML model for AM PSP of Ti64
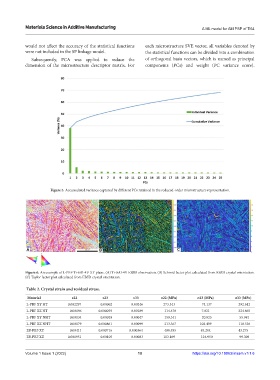
would not affect the accuracy of the statistical functions each microstructure SVE vector, all variables denoted by
were not included in the SP linkage model. the statistical functions can be divided into a combination
Subsequently, PCA was applied to reduce the of orthogonal basis vectors, which is named as principal
dimension of the microstructure descriptor matrix. For components (PCs) and weight (PC variance score).
Figure 5. Accumulated variance captured by different PCs retained in the reduced-order microstructure representation.
A B C
Figure 6. An example of L-PBF Ti-6Al-4V XY plane. (A) Ti-6Al-4V EBSD observation. (B) Schmid factor plot calculated from EBSD crystal orientation.
(C) Taylor factor plot calculated from EBSD crystal orientation.
Table 2. Crystal strain and residual stress.
Material ε22 ε23 ε33 σ22 (MPa) σ23 (MPa) σ33 (MPa)
L-PBF XY HT 0.002297 −0.00062 −0.00246 273.343 −74.137 −292.612
L-PBF XZ HT −0.00096 0.000059 −0.00189 −114.478 7.021 −224.865
L-PBF XY NHT −0.00134 −0.00018 −0.00047 −159.341 −20.825 −55.981
L-PBF XZ NHT −0.00179 0.000861 −0.00099 −213.367 102.459 −118.336
EB-PBF XY −0.00411 0.000716 0.000364 −488.495 85.204 43.275
EB-PBF XZ 0.000951 −0.00105 −0.00083 113.169 −124.950 −99.309
Volume 1 Issue 1 (2022) 10 https://doi.org/10.18063/msam.v1i1.6