
Page 29 - MSAM-1-4
P. 29
Materials Science in Additive Manufacturing Process optimization of SEBM IN718 via ML
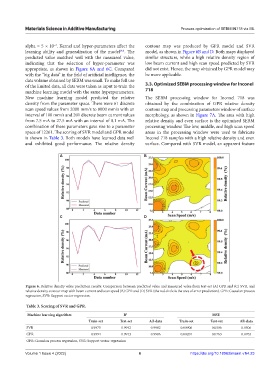
alpha = 5 × 10 . Kernel and hyper-parameters affect the contour map was produced by GPR model and SVR
−3
learning ability and generalization of the model . The model, as shown in Figure 6B and D. Both maps displayed
[47]
predicted value matched well with the measured value, similar structure, while a high relative density region of
indicating that the selection of hyper-parameter was low beam current and high scan speed predicted by SVR
appropriate, as shown in Figure 6A and 6C. Compared did not exist. Hence, the map obtained by GPR model may
with the “big data” in the field of artificial intelligence, the be more applicable.
data volume obtained by SEBM was small. To make full use
of the limited data, all data were taken as input to train the 3.3. Optimized SEBM processing window for Inconel
machine learning model with the same hyperparameters. 718
New machine learning model predicted the relative The SEBM processing window for Inconel 718 was
density from the parameter space. There were 61 discrete obtained by the combination of GPR relative density
scan speed values from 2000 mm/s to 8000 mm/s with an contour map and processing parameters window of surface
interval of 100 mm/s and 201 discrete beam current values morphology, as shown in Figure 7A. The area with high
from 7.5 mA to 27.5 mA with an interval of 0.1 mA. The relative density and even surface is the optimized SEBM
combination of these parameters gave rise to a parameter processing window. The low, middle, and high scan speed
space of 12261. The scoring of SVR model and GPR model areas in the processing window were used to fabricate
is shown in Table 3. Both models have learned data well Inconel 718 samples with a high relative density and even
and exhibited good performance. The relative density surface. Compared with SVR model, an apparent feature
A B
C D
Figure 6. Relative density value prediction results: Comparison between predicted value and measured value from test-set (A) GPR and (C) SVR, and
relative density contour map with beam current and scan speed (B) GPR and (D) SVR (the red circle is the area of error prediction). GPR: Gaussian process
regression, SVR: Support vector regression.
Table 3. Scoring of SVR and GPR.
Machine learning algorithm R 2 MSE
Train‑set Test‑set All‑data Train‑set Test‑set All‑data
SVR 0.9975 0.9942 0.9982 0.00906 0.0506 0.0506
GPR 0.9994 0.9913 0.9986 0.00201 0.0763 0.0763
GPR: Gaussian process regression, SVR: Support vector regression
Volume 1 Issue 4 (2022) 6 https://doi.org/10.18063/msam.v1i4.23