
Page 30 - MSAM-1-4
P. 30
Materials Science in Additive Manufacturing Process optimization of SEBM IN718 via ML
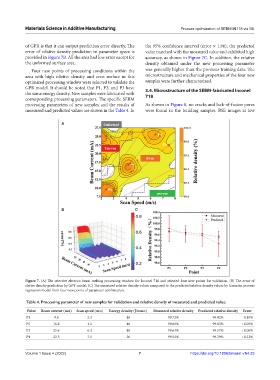
of GPR is that it can output prediction error directly. The the 95% confidence interval (error × 1.96), the predicted
error of relative density prediction in parameter space is value matched with the measured value and exhibited high
provided in Figure 7B. All the area had low error except for accuracy, as shown in Figure 7C. In addition, the relative
the unformed surface area. density obtained under the new processing parameter
Four new points of processing conditions within the was generally higher than the previous training data. The
area with high relative density and even surface in this microstructure and mechanical properties of the four new
optimized processing window were selected to validate the samples were further characterized.
GPR model. It should be noted that P1, P2, and P3 have 3.4. Microstructure of the SEBM-fabricated Inconel
the same energy density. New samples were fabricated with 718
corresponding processing parameters. The specific SEBM
processing parameters of new samples and the results of As shown in Figure 8, no cracks and lack-of-fusion pores
measured and predicted values are shown in the Table 4. In were found in the building samples. BSE images at low
A
B C
Figure 7. (A) The selective electron beam melting processing window for Inconel 718 and selected four new points for validation. (B) The error of
elative density prediction by GPT model. (C) The measured relative density values compared to the predicted relative density values by Gaussian process
regression model from four new points of parameter combination.
Table 4. Processing parameter of new samples for validation and relative density of measured and predicted value.
Point Beam current (mA) Scan speed (m/s) Energy density (J/mm≥) Measured relative density Predicted relative density Error
P1 9.6 2.4 48 99.72% 99.82% −0.10%
P2 16.8 4.2 48 99.68% 99.63% +0.05%
P3 25.6 6.4 48 99.63% 99.57% +0.06%
P4 22.5 7.5 36 99.52% 99.29% +0.23%
Volume 1 Issue 4 (2022) 7 https://doi.org/10.18063/msam.v1i4.23