
Page 27 - MSAM-1-4
P. 27
Materials Science in Additive Manufacturing Process optimization of SEBM IN718 via ML
evaluated based on optical images. Inconel 718 alloy
samples with four different processing parameters
were selected for characterization from the processing
window. All the sectioned samples were mounted and
metallographically ground and polished using typical
metallographic procedure. The backscattered electron
(BSE) images of as-built samples microstructure were
observed using scanning electron microscopy (SEM,
FEI Quanta 650). Inverse pole figure (IPF) maps of the
SEBM Inconel 718 were characterized by electron back-
scattered diffraction (EBSD) analysis. The observation
region is in the middle of the sample and parallel to the
building direction (BD). The hardness of each as-built
sample was measured by the Vickers microhardness
tester (THV-10), with load and dwell time of 1 kgf and
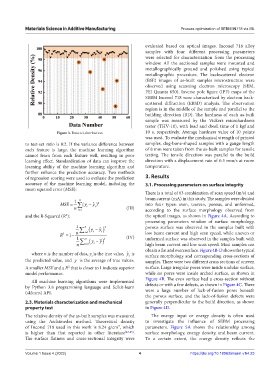
Figure 3. Data set distribution. 10 s, respectively. Average hardness value of 10 points
was used. To evaluate the mechanical strength of printed
to test-set ratio is 8:2. If the variance difference between samples, dog-bone-shaped samples with a gauge length
each feature is large, the machine learning algorithm of 8 mm were taken from the as-built samples for tensile
cannot learn from each feature well, resulting in poor testing. The tensile direction was parallel to the build
learning effect. Standardization of data can improve the direction with a displacement rate of 0.5 mm/s at room
learning ability of the machine learning algorithm and temperature.
further enhance the prediction accuracy. Two methods
of regression scoring were used to evaluate the prediction 3. Results
accuracy of the machine learning model, including the 3.1. Processing parameters on surface integrity
mean squared error (MSE):
There is a total of 63 combination of scan speed (m/s) and
beam current (mA) in this study. The samples were divided
1 n
MSE = ∑ (y − ˆ y ) 2 into four types: even, uneven, porous, and unformed,
n i =1 i i (III) according to the surface morphology observed from
and the R-Squared (R²): the optical images, as shown in Figure 4A. According to
processing parameters window of surface morphology,
1 n ( y − ˆ y ) 2 porous surface was observed in the samples built with
R 2 = − n ∑ i =1 i i low beam current and high scan speed, while uneven or
1
1 n − 2 (IV) unformed surface was observed in the samples built with
n ∑ i =1 ( y i ) y high beam current and low scan speed. Most samples can
obtain a flat and even surface. Figure 4B-D shows the typical
where n is the number of data, y is the true value, ˆ y is surface morphology and corresponding cross-sections of
i
i
the predicted value, and y is the average of true values. samples. There were two different cross sections of uneven
A smaller MSE and a R² that is closer to 1 indicate superior surface. Large irregular pores were inside undular surface,
model performance. while no pores were inside arched surface, as shown in
Figure 4B. The even surface had a cross-section without
All machine learning algorithms were implemented
by Python 3.8 programming language and Scikit-learn defects or with a few defects, as shown in Figure 4C. There
were a large number of lack-of-fusion pores beneath
(sklearn) API.
the porous surface, and the lack-of-fusion defects were
2.3. Materials characterization and mechanical generally perpendicular to the build direction, as shown
property test in Figure 4D.
The relative density of the as-built samples was measured The energy input or energy density is often used
using the Archimedes method. Theoretical density to investigate the influence of SEBM processing
of Inconel 718 used in this work is 8.24 g/cm³, which parameters. Figure 5A shows the relationship among
is higher than that reported in other literature [43-45] . surface morphology, energy density, and beam current.
The surface flatness and cross-sectional integrity were To a certain extent, the energy density reflects the
Volume 1 Issue 4 (2022) 4 https://doi.org/10.18063/msam.v1i4.23