
Page 45 - MSAM-1-4
P. 45
Materials Science in Additive Manufacturing Acoustic performances of SC lattices fabricated by DLP
calculated with δ and δ calculated from the proposed same strut length. The mean and standard deviations of the
1
2
models. The mean absolute error of the absorption absorption coefficients are also plotted in Figure 5.
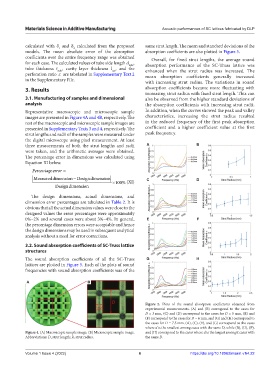
coefficients over the entire frequency range was obtained Overall, for fixed strut lengths, the average sound
for each case. The calculated values of tube side length d , absorption performance of the SC-Truss lattice was
tube
tube thickness t , cavity layer thickness l , and the enhanced when the strut radius was increased. The
cav
tube
perforation ratio ε are tabulated in Supplementary Text 2 mean absorption coefficients generally increased
in the Supplementary File. with increasing strut radius. The variations in sound
3. Results absorption coefficients became more fluctuating with
increasing strut radius with fixed strut length. This can
3.1. Manufacturing of samples and dimensional also be observed from the higher standard deviations of
analysis the absorption coefficients with increasing strut radii.
Representative macroscopic and microscopic sample In addition, when the curves showed the peak and valley
images are presented in Figure 4A and 4B, respectively. The characteristics, increasing the strut radius resulted
rest of the macroscopic and microscopic sample images are in the reduced frequency of the first peak absorption
presented in Supplementary Texts 3 and 4, respectively. The coefficient and a higher coefficient value at the first
strut lengths and radii of the samples were measured under peak frequency.
the digital microscope using pixel measurement. At least
three measurements of both the strut lengths and radii A B
were taken, and the arithmetic averages were obtained.
The percentage error in dimensions was calculated using
Equation XI below.
Percentageerror
MeasureddimensionDesigndimension 100% (XI) C D
Designdimeension
The design dimensions, actual dimensions, and
dimension error percentages are tabulated in Table 2. It is
obvious that all the actual dimension values were close to the
designed values the error percentages were approximately
0%–2% and several cases were about 3%–4%. In general, E F
the percentage dimension errors were acceptable and hence
the design dimensions may be used in subsequent analytical
analysis without a need for error corrections.
3.2. Sound absorption coefficients of SC-Truss lattice
structures
The sound absorption coefficients of all the SC-Truss G H
lattices are plotted in Figure 5. Each of the plots of sound
frequencies with sound absorption coefficients was of the
A B
Figure 5. Plots of the sound absorption coefficients obtained from
experimental measurements. (A) and (B) correspond to the cases for
D = 3 mm, (C) and (D) correspond to the cases for D = 5 mm, (E) and
(F) correspond to the cases for D = 6 mm, and (G) and (H) correspond to
the cases for D = 7.5 mm. (A), (C), (E), and (G) correspond to the cases
where d is the smallest among cases with the same D, while (B), (D), (F),
Figure 4. (A) Macroscopic sample image. (B) Microscopic sample image. and (H) correspond to the cases where d is the largest amongst cases with
Abbreviations: D, strut length; R, strut radius. the same D.
Volume 1 Issue 4 (2022) 6 https://doi.org/10.18063/msam.v1i4.22