
Page 47 - MSAM-1-4
P. 47
Materials Science in Additive Manufacturing Acoustic performances of SC lattices fabricated by DLP
A B Similarly, δ could be a function of the perforation ratio
1
ε (Figure 7B). Such a hypothesis is because the reactance
correction factor is already a function of d tube and similar
t
tube
hypothesis on δ were made in the previous works .
[29]
2
However, it can be seen that δ was zero when the
2
perforation ratio was too low or too high, while δ peaks
2
when the perforation ratio is around 0.35. Henceforth, it
C D was proposed that the data points are divided into two
equal subsets based on the porosity φ of the lattice samples.
By applying linear regression on each of the subsets, the
following empirical piecewise relation for δ was obtained:
2
0 6893
.
1 9320 0 3012 . for .
(XIII)
0 6893
0 5879 for
2
0 7545
. . .
2
E F The coefficients of determination R for the two linear
regression lines were 0.8629 and 0.4782, respectively.
While the first regression line fits the data points well, the
linear correlation between the perforation ratio and δ was
2
relatively weak, owing to the large variations in values of δ
2
at higher porosities.
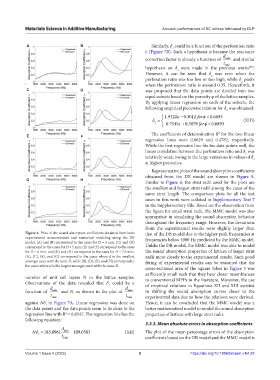
Representative plots of the sound absorption coefficients
obtained from the DB model are shown in Figure 8.
G H
Similar to Figure 6, the strut radii used for the plots are
the smallest and largest strut radii among the cases of the
same strut length. The comparison plots for all the test
cases in this work were collated in Supplementary Text 7
in the Supplementary File. Based on the observation from
the figure for small strut radii, the MMC model was also
appropriate in simulating the sound absorption behavior
throughout the frequency range. However, the deviations
from the experimental results were slightly larger than
Figure 6. Plots of the sound absorption coefficients obtained from both that of the DB model due to the higher peak frequencies at
experimental measurements and numerical modeling using the DB frequencies below 4000 Hz predicted by the MMC model.
model. (A) and (B) correspond to the cases for D = 3 mm, (C) and (D)
correspond to the cases for D = 5 mm, (E) and (F) correspond to the cases Unlike the DB model, the MMC model was able to model
for D = 6 mm, and (G) and (H) correspond to the cases for D = 7.5 mm. the sound absorption properties of lattices of larger strut
(A), (C), (E), and (G) correspond to the cases where d is the smallest radii more closely to the experimental results. Such good
amongst cases with the same D, while (B), (D), (F), and (H) correspond to fitting of experimental results can be reasoned that the
the cases where d is the largest amongst cases with the same D.
cross-sectional area of the square tubes in Figure 3 was
sufficiently small such that they bear closer resemblances
number of unit cell layers N in the lattice samples. to conventional MPPs in the literature. Moreover, the use
Observations of the data revealed that δ could be a of empirical relations in Equations XII and XIII assisted
1
d d
function of tube and N, as shown in the plot of tube in shifting the sound absorption curves closer to the
t tube t tube experimental data due to how the relations were derived.
against Nδ in Figure 7A. Linear regression was done on Hence, it can be concluded that the MMC model was a
1
the data points and the data points seem to lie close to the better mathematical model to model the sound absorption
regression line with R = 0.8547. The regression line has the properties of lattices with large strut radii.
2
following equation:
3.3.3. Mean absolute errors in absorption coefficients
d
tube
N 183 0961. t tube 109 0583. (XII) The plot of the mean percentage errors of the absorption
1
coefficients based on the DB model and the MMC model is
Volume 1 Issue 4 (2022) 8 https://doi.org/10.18063/msam.v1i4.22