
Page 46 - MSAM-1-4
P. 46
Materials Science in Additive Manufacturing Acoustic performances of SC lattices fabricated by DLP
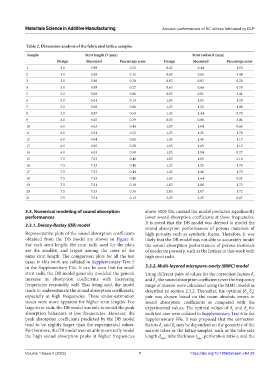
Table 2. Dimension analysis of the fabricated lattice samples
Sample Strut length D (mm) Strut radius R (mm)
Design Measured Percentage error Design Measured Percentage error
1 3.0 2.99 0.22 0.43 0.44 1.55
2 3.0 3.00 0.11 0.63 0.65 3.44
3 3.0 2.98 0.78 0.83 0.83 0.20
4 5.0 4.99 0.27 0.63 0.66 4.76
5 5.0 5.00 0.00 0.83 0.81 2.41
6 5.0 5.01 0.13 1.03 1.02 1.29
7 5.0 5.00 0.00 1.23 1.22 1.08
8 5.0 4.97 0.53 1.43 1.44 0.70
9 6.0 6.02 0.39 0.83 0.86 3.01
10 6.0 6.03 0.44 1.03 1.04 0.65
11 6.0 6.01 0.22 1.23 1.25 1.76
12 6.0 6.04 0.61 1.43 1.45 1.17
13 6.0 6.02 0.28 1.63 1.65 1.12
14 6.0 6.03 0.50 1.83 1.84 0.27
15 7.5 7.53 0.40 1.03 1.05 2.10
16 7.5 7.53 0.40 1.23 1.25 1.76
17 7.5 7.53 0.44 1.43 1.46 1.75
18 7.5 7.53 0.40 1.63 1.64 0.51
19 7.5 7.51 0.18 1.83 1.86 1.73
20 7.5 7.53 0.36 2.03 2.07 1.72
21 7.5 7.51 0.13 2.23 2.25 0.67
3.3. Numerical modeling of sound absorption above 5000 Hz, instead the model predicted significantly
performances lower sound absorption coefficients at those frequencies.
It is noted that the DB model was derived to model the
3.3.1. Delany-Bazley (DB) model
sound absorption performances of porous materials of
Representative plots of the sound absorption coefficients high porosity such as synthetic foams. Therefore, it was
obtained from the DB model are shown in Figure 6. likely that the DB model was not able to accurately model
For each strut length, the strut radii used for the plots the sound absorption performances of porous materials
are the smallest and largest among the cases of the of moderate porosity, such as the lattices in this work with
same strut length. The comparison plots for all the test high strut radii.
cases in this work are collated in Supplementary Text 5
in the Supplementary File. It can be seen that for small 3.3.2. Multi-layered micropore-cavity (MMC) model
strut radii, the DB model generally modeled the general Using different pairs of values for the correction factors δ
1
increase in absorption coefficients with increasing and δ , the sound absorption coefficients over the frequency
1
frequencies reasonably well. That being said, the model range of interest were calculated using the MMC model as
tends to underestimate the sound absorption coefficients, described in section 2.3.2. Thereafter, the optimal {δ δ }
1, 2
especially at high frequencies. These under-estimation pair was chosen based on the mean absolute errors in
issues were more apparent for higher strut lengths. For sound absorption coefficients as compared with the
large strut radii, the DB model was able to model the peak experimental values. The optimal values of δ and δ for
1
2
absorption behaviors at low frequencies. However, the each test case were collated in Supplementary Text 6 in the
peak absorption coefficients predicted by the DB model Supplementary File. It was proposed that the correction
tend to be slightly larger than the experimental values. factors δ and δ may be dependent on the geometry of the
2
1
Furthermore, the DB model was not able to correctly model narrow tubes or the lattice samples, such as the tube side
the high sound absorption peaks at higher frequencies length d , tube thickness t , perforation ratio ε, and the
tube tube
Volume 1 Issue 4 (2022) 7 https://doi.org/10.18063/msam.v1i4.22