
Page 36 - MSAM-2-3
P. 36
Materials Science in Additive Manufacturing Cast and 3D-printed fiber orientations
The relationship between the printing parameters and
the dimension of printed filaments is shown in Figure 19.
The pair of printing parameters of test runs 1, 2, and 3
follows the matching criteria. The dimensions of each
printed filament are plotted in Figure 19A. The nozzle
adopted for printing is 12.98 mm × 28.62 mm (H × W). As
shown in Figure 19A, with printing parameters following
the matching criteria, printed filaments have almost
the same dimensions as the size of the nozzle opening.
The slight difference between the dimensions of printed
filament and nozzle head opening is possible due to the
material slump, resulting in decreased filament height and
width.
The pair of printing parameters of test runs 4, 5, 6, and 7
does not follow the matching criteria. Figure 19B shows the
dimensions of printed filaments. As shown in Figure 19B,
with the increase of nozzle movement speed from 40 mm/s Figure 20. Comparison among the 1D prediction, 2D prediction, and
to 100 mm/s while material bulk velocity maintains a experimental values of the random casting process.
constant, both the width and height of printed filaments
decrease due to the volumetric conservation principle.
5.2. Comparison between theoretical and
experimental results
Figure 20A presents a comparison between the results of
the 1D and 2D boundary models with experimental results.
As shown in figure, the 2D boundary constraints model
provides better prediction accuracy than the 1D model.
However, it is also evident that prediction results based
on 2D boundary constraints exhibit a large variance from
the experimental value. This variation might be attributed
to the non-ideal random conditions in the RC process,
where vibrations during the casting process could induce
material flow, generate flow streamlines, and change fiber
orientation. As a consequence, the fibers of RC specimens
exhibit higher directional orientation than that calculated
by the theoretical models. Figure 21. Comparison between the computational fluid dynamics
simulation results and the experimental results of the directional casting
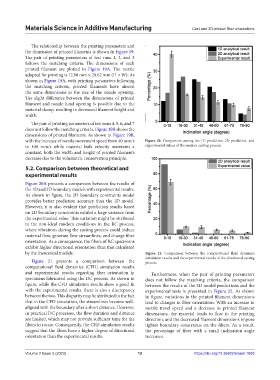
Figure 21 presents a comparison between the process.
computational fluid dynamics (CFD) simulation results
and experimental results regarding fiber orientation in Furthermore, when the pair of printing parameters
specimens fabricated using the DC process. As shown in does not follow the matching criteria, the comparison
figure, while the CFD simulation results show a good fit between the results of the 2D model predictions and the
with the experimental results, there is also a discrepancy experimental tests is presented in Figure 22. As shown
between the two. This disparity may be attributed to the fact in figure, variations in the printed filament dimensions
that in the CFD simulation, the streamlines become well- lead to changes in fiber orientation. With an increase in
aligned with the boundary after a short distance. However, nozzle travel speed and a decrease in printed filament
in practical DC processes, the flow duration and distance dimensions, the material tends to flow in the printing
are limited, which may not provide sufficient time for the direction, and the decreased filament dimensions impose
fibers to rotate. Consequently, the CFD simulation results tighter boundary constraints on the fibers. As a result,
suggest that the fibers have a higher degree of directional the percentage of fiber with a small inclination angle
orientation than the experimental results. increases.
Volume 2 Issue 3 (2023) 12 https://doi.org/10.36922/msam.1603