
Page 37 - MSAM-2-3
P. 37
Materials Science in Additive Manufacturing Cast and 3D-printed fiber orientations
A B
D
C
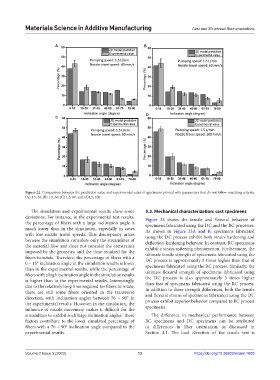
Figure 22. Comparison between the prediction value and experimental value of specimens printed with parameters that do not follow matching criteria:
(A) 1.5, 40; (B) 1.5, 60; (C) 1.5, 80; and (d)1.5, 100
The simulation and experimental results show some 5.3. Mechanical characterization: cast specimens
deviations. For instance, in the experimental test results, Figure 23 shows the tensile and flexural behavior of
the percentage of fibers with a large inclination angle is specimens fabricated using the DC and the RC processes.
much lower than in the simulation, especially in cases As shown in Figure 23A and B, specimens fabricated
with low nozzle travel speeds. This discrepancy arises using the DC process exhibit both strain-hardening and
because the simulation considers only the streamlines of deflection-hardening behavior. In contrast, RC specimens
the material flow and does not consider the constraints exhibit a strain-softening phenomenon. Furthermore, the
imposed by the geometry and the time required for the ultimate tensile strength of specimens fabricated using the
fibers to rotate. Therefore, the percentage of fibers with a DC process is approximately 3 times higher than that of
0 – 15° inclination angle in the simulation results is lower specimens fabricated using the RC process. Similarly, the
than in the experimental results, while the percentage of ultimate flexural strength of specimens fabricated using
fibers with a high inclination angle in the simulation results
is higher than in the experimental results. Interestingly, the DC process is also approximately 3 times higher
than that of specimens fabricated using the RC process.
due to the relatively long time required for fibers to rotate, In addition to these strength differences, both the tensile
there are still some fibers oriented in the transverse
direction, with inclination angles between 76 – 90° in and flexural strains of specimens fabricated using the DC
the experimental results. However, in the simulation, the process exhibit superior behavior compared to RC process
influence of nozzle movement makes it difficult for the specimens.
streamlines to exhibit such large inclination angles. These The difference in mechanical performance between
factors contribute to the lower simulated percentage of RC specimens and DC specimens can be attributed
fibers with a 76 – 90° inclination angle compared to the to differences in fiber orientation, as discussed in
experimental results. Section 4.1. The load direction of the tensile test is
Volume 2 Issue 3 (2023) 13 https://doi.org/10.36922/msam.1603