
Page 62 - MSAM-3-1
P. 62
Materials Science in Additive Manufacturing Customized scans and dwell time on AM 316L
the sample in 10 × 10 × 10 mm dimensions. The print After the parts were printed, they were cut into sections
3
parameters were laser power of 340 watts, scanning speed using an electric hacksaw. These sectioned samples were
of 16 mm/s, powder feed rate of 7.89 g/min, laser spot size cleaned in an ultrasonic bath and subsequently embedded
of 0.5 mm, layer height of 0.5 mm, and specific energy (E) in epoxy resin, oriented along the build direction, to
of 21.25 J/mm . These parameters were replicated from the prepare them for metallographic analysis. To examine the
2
previous parametric optimization study. A Nd: YAG laser microstructure, the samples were etched using a solution
10
with a wavelength of 1068.7 nm was used with a standoff containing 15 mL HCl, 10 mL HNO , and 10 mL acetic
3
distance of 9.525 mm. As shown in Figure 3, the parts were acid for 30 s. Further characterizations were carried by
printed in customized unidirectional and bidirectional means of scanning electron microscopy (SEM) and energy
scan patterns with 0, 10, and 15 s of dwell time in between dispersive spectroscopy (EDS) using a Thermo Fisher Axia
the print layers in a controlled argon (Ar) atmosphere. ChemiSEM (ThermoFisher Scientific, USA), utilizing
The first three samples (i.e., S1, S2, S3) were printed in a spot size of 0.1 μm to elicit quantitative elemental
a unidirectional scan pattern where the toolpath was composition and mapping information. The density of
consistent, and there were no abrupt changes in deposition the samples was determined using the Ohaus density
direction. The remaining three samples (i.e., S4, S5, S6) determination kit (OHAUS, USA), which is based on the
were printed in a bidirectional scan pattern where the Archimedes’ principle. In addition, the ZeGage Plus 3D
22
beam direction is reversed in each pass, and the starting profilometer (Zygo Corporation, USA) was utilized to
location of the beam is moved diagonally away from the measure the roughness of the as-printed parts and create
end location of the prior layer. 3D roughness maps.
A B
Figure 2. (A) Powder 316L stainless steel micro-computed tomography analysis; (B) X-Y cross section showing the presence of minor internal pores.
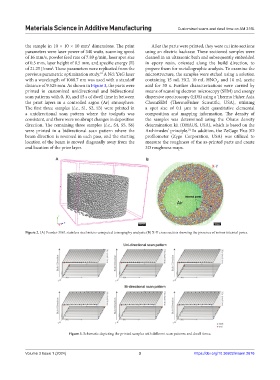
Figure 3. Schematic depicting the printed samples with different scan patterns and dwell times.
Volume 3 Issue 1 (2024) 3 https://doi.org/10.36922/msam.2676