
Page 66 - MSAM-3-1
P. 66
Materials Science in Additive Manufacturing Customized scans and dwell time on AM 316L
A B
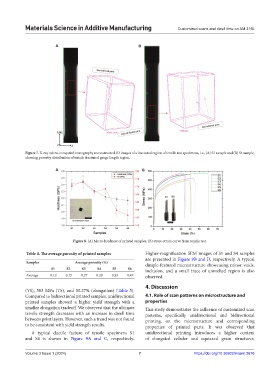
Figure 7. X-ray micro-computed tomography reconstructed 3D images of a fractured region of tensile test specimens, i.e., (A) S1 sample and (B) S4 sample,
showing porosity distribution of tensile fractured gauge length region.
A B
Figure 8. (A) Micro-hardness of printed samples; (B) stress-strain curve from tensile test.
Table 4. The average porosity of printed samples Higher-magnification SEM images of S1 and S4 samples
are presented in Figure 9B and D, respectively. A typical
Samples Average porosity (%) dimple-featured microstructure showcasing minor voids,
S1 S2 S3 S4 S5 S6 inclusion, and a small trace of unmelted region is also
Average 0.12 0.15 0.27 0.29 0.33 0.49 observed.
4. Discussion
(YS), 583 MPa (TS), and 50.27% (elongation) (Table 5).
Compared to bidirectional printed samples, unidirectional 4.1. Role of scan patterns on microstructure and
printed samples showed a higher yield strength with a properties
smaller elongation tradeoff. We observed that the ultimate This study demonstrates the influence of customized scan
tensile strength decreases with an increase in dwell time patterns, specifically unidirectional and bidirectional
between print layers. However, such a trend was not found printing, on the microstructure and corresponding
to be consistent with yield strength results. properties of printed parts. It was observed that
A typical ductile facture of tensile specimens S1 unidirectional printing introduces a higher content
and S4 is shown in Figure 9A and C, respectively. of elongated cellular and equiaxed grain structures,
Volume 3 Issue 1 (2024) 7 https://doi.org/10.36922/msam.2676