
Page 64 - MSAM-3-1
P. 64
Materials Science in Additive Manufacturing Customized scans and dwell time on AM 316L
A
B
C
D
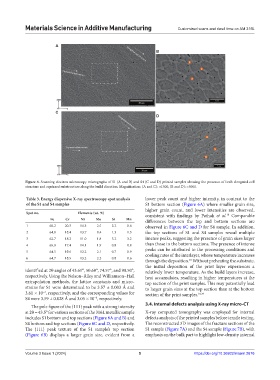
Figure 4. Scanning electron microscopy micrographs of S1 (A and B) and S4 (C and D) printed samples showing the presence of both elongated cell
structure and equiaxed substructure along the build direction. Magnification: (A and C): ×1500; (B and D): ×5000.
Table 3. Energy dispersive X‑ray spectroscopy spot analysis lower peak count and higher intensity, in contrast to the
of the S1 and S4 samples S1 bottom section (Figure 6A) where smaller grain size,
higher grain count, and lower intensities are observed,
Spot no. Elements (wt. %) consistent with findings by Pathak et al. Comparable
10
Fe Cr Ni Mo Si Mn differences between the top and bottom sections are
1 60.2 20.3 14.3 2.5 2.2 0.6 observed in Figure 6C and D for S4 sample. In addition,
2 64.8 18.4 13.7 0.4 1.3 1.3 the top sections of S1 and S4 samples reveal multiple
3 62.7 18.2 11.0 1.8 3.2 3.2 intense peaks, suggesting the presence of grain sizes larger
4 65.0 17.4 14.1 1.9 0.9 0.8 than those in the bottom sections. The presence of intense
5 64.5 19.6 12.2 2.1 0.7 0.9 peaks can be attributed to the processing conditions and
6 64.7 18.5 13.2 2.2 0.8 0.6 cooling rates of the interlayer, whose temperature increases
10
through the deposition. Without preheating the substrate,
the initial deposition of the print layer experiences a
identified at 2θ angles of 43.61°, 50.68°, 74.57°, and 90.50°, relatively lower temperature. As the build layers increase,
respectively. Using the Nelson–Riley and Williamson–Hall heat accumulates, resulting in higher temperatures at the
extrapolation methods, the lattice constants and micro- top section of the print samples. This may potentially lead
strains for S1 were determined to be 3.57 ± 0.003 Å and to larger grain sizes at the top section than at the bottom
3.61 × 10 , respectively, and the corresponding values for section of the print samples. 10,29
−3
S4 were 3.59 ± 0.028 Å and 3.05 × 10 , respectively.
−3
The pole figure of the {111} peak with a strong intensity 3.4. Internal defects analysis using X-ray micro-CT
at 2θ = 43.5° for various sections of the 316L metallic sample X-ray computed tomography was employed for internal
includes S1 bottom and top sections (Figure 6A and B) and defects analysis of the printed samples before tensile testing.
S4 bottom and top sections (Figure 6C and D, respectively. The reconstructed 3D images of the fracture sections of the
The {111} peak texture of the S1 sample’s top section S1 sample (Figure 7A) and the S4 sample (Figure 7B), with
(Figure 6B) displays a larger grain size, evident from a emphasis on the bulk part to highlight low-density internal
Volume 3 Issue 1 (2024) 5 https://doi.org/10.36922/msam.2676