
Page 65 - MSAM-3-1
P. 65
Materials Science in Additive Manufacturing Customized scans and dwell time on AM 316L
A B
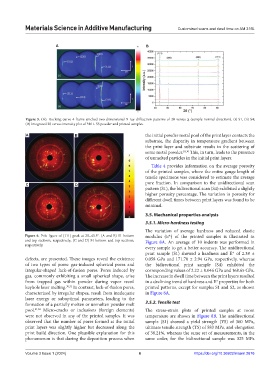
Figure 5. (A). Rocking curve 4-frame stitched two-dimensional X-ray diffraction patterns of 2θ versus χ (sample normal direction), (i) S1, (ii) S4;
(B) Integrated 2θ versus intensity plot of 316 L SS powder and printed samples.
A B the initial powder metal pool of the print layer contacts the
substrate, the disparity in temperature gradient between
the print layer and substrate results in the scattering of
some metal powder. 10,30 This, in turn, leads to the presence
of unmelted particles in the initial print layers.
Table 4 provides information on the average porosity
of the printed samples, where the entire gauge length of
tensile specimens was considered to estimate the average
C D pore fraction. In comparison to the unidirectional scan
pattern (S1), the bidirectional scan (S4) exhibited a slightly
higher porosity percentage. The variation in porosity for
different dwell times between print layers was found to be
minimal.
3.5. Mechanical properties analysis
3.5.1. Micro-hardness testing
The variation of average hardness and reduced elastic
Figure 6. Pole figure of {111} peak at 2θ=43.5°. (A and B) S1 bottom modulus (E*) of the printed samples is illustrated in
and top sections, respectively; (C and D) S4 bottom and top sections, Figure 8A. An average of 10 indents was performed in
respectively.
every sample to get a better accuracy. The unidirectional
print sample (S1) showed a hardness and E* of 2.38 ±
defects, are presented. These images reveal the existence 0.058 GPa and 171.70 ± 2.94 GPa, respectively, whereas
of two types of pores: gas-induced spherical pores and the bidirectional print sample (S4) exhibited the
irregular-shaped lack-of-fusion pores. Pores induced by corresponding values of 2.22 ± 0.046 GPa and 168.65 GPa.
gas, commonly exhibiting a small spherical shape, arise The increase in dwell time between the print layers resulted
from trapped gas within powder during vapor recoil in a declining trend of hardness and E* properties for both
keyhole laser melting. 30,31 In contrast, lack-of-fusion pores, printed patterns, except for samples S1 and S2, as shown
characterized by irregular shapes, result from inadequate in Figure 8A.
laser energy or suboptimal parameters, leading to the
formation of a partially molten or unmolten powder melt 3.5.2. Tensile test
pool. 31,32 Micro-cracks or inclusions (foreign elements) The stress-strain plots of printed samples at room
were not observed in any of the printed samples. It was temperature are shown in Figure 8B. The unidirectional
observed that the number of pores formed at the initial sample (S1) showed a yield strength (YS) of 360 MPa,
print layers was slightly higher but decreased along the ultimate tensile strength (TS) of 583 MPa, and elongation
print build direction. One plausible explanation for this of 38.21%, whereas the same set of measurements, in the
phenomenon is that during the deposition process when same order, for the bidirectional sample was 325 MPa
Volume 3 Issue 1 (2024) 6 https://doi.org/10.36922/msam.2676