
Page 36 - MSAM-4-1
P. 36
Materials Science in Additive Manufacturing TPMS for perfect sound absorption
examining the variation curve of k” with frequency, the
bandgap range (i.e., the frequency range where k” ≠ 0)
can be determined, as marked with a black diagonal line.
The gyroid structure with a thickness of 18 mm exhibits
a wide flat band, which is an acoustic bandgap between
3460 and 4320 Hz (Figure 9C). This acoustic bandgap
corresponds to the first resonance peak (f = 3900 Hz;
1
α = 0.535) of Gyroid-18 mm, and the sound absorption
1
coefficient between 3460 and 4320 Hz is higher than 0.5.
The acoustic bandgap of Gyroid-24 mm is between 2080
and 3000 Hz, corresponding to the first resonance peak (f 1
= 2590 Hz; α = 0.651) of Gyroid-24 mm. In contrast, two
1
acoustic bandgaps were observed for Gyroid-30 mm. The
first bandgap is between 2020 and 2770 Hz, corresponding
to the first resonance peak (f = 2000 Hz; α = 0.725) of
1
1
Gyroid-30 mm; the second bandgap is between 4540 and
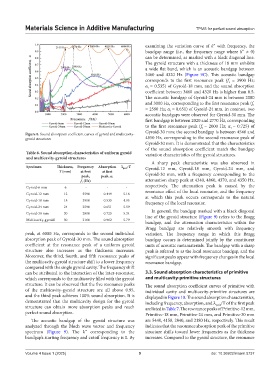
Figure 8. Sound absorption coefficient curves of gyroid and multicavity-
gyroid structures 4850 Hz, corresponding to the second resonance peak of
Gyroid-30 mm. It is demonstrated that the characteristics
of the sound absorption coefficient match the bandgap
Table 6. Sound absorption characteristics of uniform gyroid variation characteristics of the gyroid structures.
and multicavity‑gyroid structures
A sharp peak characteristic was also observed in
Specimen Thickness, Frequency Absorption λ peak /T Gyroid-12 mm, Gyroid-18 mm, Gyroid-24 mm, and
T (mm) at first at first
peak, peak, α 1 Gyroid-30 mm, with a frequency corresponding to the
f 1 (Hz) attenuation sharp peak at 4340, 4860, 4370, and 4350 Hz,
Gyroid-6 mm 6 - - - respectively. The attenuation peak is caused by the
Gyroid-12 mm 12 5590 0.449 5.18 resonance effect of the local resonator, and the frequency
at which this peak occurs corresponds to the natural
Gyroid-18 mm 18 3900 0.535 4.95 frequency of the local resonator.
Gyroid-24 mm 24 2590 0.651 5.59
In general, the bandgap marked with a black diagonal
Gyroid-30 mm 30 2000 0.725 5.34 line of the gyroid structure (Figure 9) refers to the Bragg
Multicavity-gyroid 30 2160 0.962 5.79
bandgap, and the attenuation characteristics within the
Bragg bandgap are relatively smooth with frequency
peak, at 6000 Hz, corresponds to the second individual variation. The frequency range in which this Bragg
absorption peak of Gyroid-30 mm. The sound absorption bandgap occurs is determined jointly by the constituent
coefficient at the resonance peak of a uniform gyroid units of acoustic metamaterials. The bandgap with a sharp
structure also increases as the thickness increases. peak is referred to as the local resonance bandgap, and the
Moreover, the third, fourth, and fifth resonance peaks of significant peaks appear with frequency changes in the local
the multicavity-gyroid structure shift to a lower frequency resonance bandgap.
compared with the single gyroid cavity. The frequency shift
can be attributed to the interaction of the inter-resonator, 3.3. Sound absorption characteristics of primitive
which corresponds to the multicavity filled with the gyroid and multicavity-primitive structures
structure. It can be observed that the five resonance peaks The sound absorption coefficient curves of primitive with
of the multicavity-gyroid structure are all above 0.95, individual cavity and multicavity-primitive structures are
and the third peak achieves 100% sound absorption. It is displayed in Figure 10. The sound absorption characteristics,
demonstrated that the multicavity design for the gyroid including frequency, absorption, and λ /T of the first peak
peak
structure can obtain more absorption peaks and reach are listed in Table 7. The resonance peaks of Primitive-12 mm,
perfect sound absorption. Primitive-18 mm, Primitive-24 mm, and Primitive-30 mm
The acoustic bandgap of the gyroid structure was are 5440, 4150, 2840, and 2180 Hz, respectively. This result
analyzed through the Bloch wave vector and frequency indicates that the resonance absorption peak of the primitive
spectrum (Figure 9). The k” corresponding to the structure shifts toward lower frequencies as the thickness
bandgap’s starting frequency and cutoff frequency is 0. By increases. Compared to the gyroid structure, the resonance
Volume 4 Issue 1 (2025) 9 doi: 10.36922/msam.5737