
Page 106 - OR-1-1
P. 106
A
B
C
D
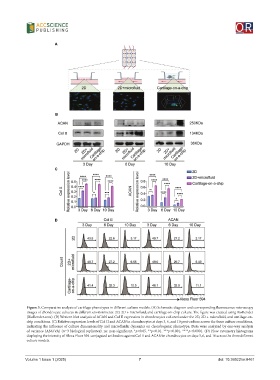
Figure 3. Comparative analysis of cartilage phenotypes in different culture models. (A) Schematic diagram and corresponding fluorescence microscopy
images of chondrocyte cultures in different environments: 2D, 2D + microfluid, and cartilage-on-chip culture. The figure was created using BioRender
(BioRender.com). (B) Western blot analysis of ACAN and Col II expression in chondrocytes cultured under the 2D, 2D + microfluid, and cartilage-on-
chip conditions. (C) Relative expression levels of Col II and ACAN in chondrocytes at days 3, 6, and 10 post-culture across the three culture conditions,
indicating the influence of culture dimensionality and microfluidic dynamics on chondrogenic phenotype. Data were analyzed by one-way analysis
of variance (ANOVA) (n=3 biological replicates); ns: non-significant, *p<0.05, **p<0.01, ***p<0.001, ****p<0.0001. (D) Flow cytometry histograms
displaying the intensity of Alexa Fluor 594-conjugated antibodies against Col II and ACAN in chondrocytes on days 3, 6, and 10 across the three different
culture models.
Volume 1 Issue 1 (2025) 7 doi: 10.36922/or.8461