
Page 65 - TD-2-2
P. 65
Tumor Discovery Enhanced SV analysis in WGS
A
B C
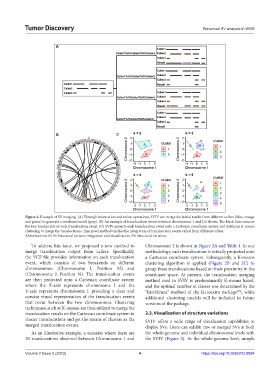
Figure 2. Example of SV merging. (A) Through intersection and union operations, SVIV can merge the initial results from different callers (blue, orange
and green) to generate a combined result (gray). (B) An example of translocation events between chromosome 1 and 2 is shown. The black lines connect
the two breakpoints of each translocation event. (C) SVIV projects each translocation event onto a Cartesian coordinate system and performs K-means
clustering to merge the translocations. This novel method enables the integration of translocation events called from different callers.
Abbreviations: SVIV: Structural variants integration and visualization; SV: Structural variation.
To address this issue, we proposed a new method to Chromosome 2 is shown in Figure 2A and Table 1. In our
merge translocation output from callers. Specifically, methodology, each translocation is initially projected onto
the VCF file provides information on each translocation a Cartesian coordinate system. Subsequently, a K-means
event, which consists of two breakends on different clustering algorithm is applied (Figure 2B and 2C) to
chromosomes: (Chromosome I, Position M) and group these translocations based on their proximity in the
(Chromosome J, Position N). The translocation events coordinate space. At present, the translocation merging
are then projected onto a Cartesian coordinate system method used in SVIV is predominantly K-means based,
where the X-axis represents chromosome I and the and the optimal number of classes was determined by the
Y-axis represents chromosome J, providing a clear and “firstSEmax” method of the factoextra package , while
[15]
concise visual representation of the translocation events additional clustering models will be included in future
that occur between the two chromosomes. Clustering versions of the package.
techniques, such as K-means, are then utilized to merge the
translocation results on the Cartesian coordinate system to 2.3. Visualization of structure variations
cluster translocations and get the means of clusters as the SVIV offers a wide range of visualization capabilities to
merged translocation events. display SVs. Users can exhibit raw or merged SVs at both
As an illustrative example, a scenario where there are the whole-genome and individual-chromosome levels with
20 translocations observed between Chromosome 1 and the SVIV (Figure 3). At the whole-genome level, sample
Volume 2 Issue 2 (2023) 4 https://doi.org/10.36922/td.0894