
Page 66 - TD-2-2
P. 66
Tumor Discovery Enhanced SV analysis in WGS
A
B
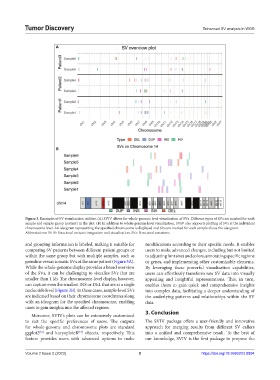
Figure 3. Examples of SV visualization utilities. (A) SVIV allows for whole-genome level visualization of SVs. Different types of SVs are marked for each
sample and sample group (patient) in the plot. (B) In addition to whole-genome level visualization, SVIV also supports plotting of SVs at the individual
chromosome level. An ideogram representing the specified chromosome is displayed and SVs are marked for each sample above the ideogram.
Abbreviations: SVIV: Structural variants integration and visualization; SVs: Structural variations.
and grouping information is labeled, making it suitable for modifications according to their specific needs. It enables
comparing SV patterns between different patient groups or users to make advanced changes, including but not limited
within the same group but with multiple samples, such as to adjusting font sizes and colors, annotating specific regions
germline versus somatic SVs of the same patient (Figure 3A). or genes, and implementing other customizable elements.
While the whole-genome display provides a broad overview By leveraging these powerful visualization capabilities,
of the SVs, it can be challenging to visualize SVs that are users can effortlessly transform raw SV data into visually
smaller than 1 kb. The chromosome-level display, however, appealing and insightful representations. This, in turn,
can capture even the smallest INS or DEL that are at a single enables them to gain quick and comprehensive insights
nucleotide level (Figure 3B). In these cases, sample-level SVs into complex data, facilitating a deeper understanding of
are indicated based on their chromosome coordinates along the underlying patterns and relationships within the SV
with an ideogram for the specified chromosome, enabling data.
users to gain insights into the affected regions.
Moreover, SVIV’s plots can be extensively customized 3. Conclusion
to suit the specific preferences of users. The outputs The SVIV package offers a user-friendly and innovative
for whole-genome and chromosome plots are standard approach for merging results from different SV callers
[16]
ggplot2 and karyoploteR objects, respectively. This into a unified and comprehensive result. To the best of
[17]
feature provides users with advanced options to make our knowledge, SVIV is the first package to propose the
Volume 2 Issue 2 (2023) 5 https://doi.org/10.36922/td.0894