
Page 65 - TD-4-1
P. 65
Tumor Discovery Drug repurposing for pancreatic cancer via AI
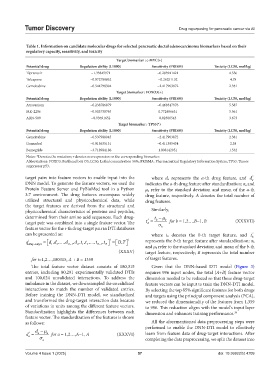
Table 1. Information on candidate molecular drugs for selected pancreatic ductal adenocarcinoma biomarkers based on their
regulatory capacity, sensitivity, and toxicity
Target biomarker : c‑MYC(+)
Potential drug Regulation ability (L1000) Sensitivity (PRISM) Toxicity (LC50, mol/kg)
Tipranavir −1.33845971 −0.283941421 4.556
Tolcapone −0.072789862 −0.26251132 4.78
Gemcitabine −0.544798394 −2.417963872 2.381
Target biomarker : FOXO3(+)
Potential drug Regulation ability (L1000) Sensitivity (PRISM) Toxicity (LC50, mol/kg)
Atracurium −0.238786879 −0.468347976 5.587
MK-2206 −0.503738765 0.772406631 5.561
ARN-509 −0.93691652 0.02300543 3.673
Target biomarker : TP53(*)
Potential drug Regulation ability (L1000) Sensitivity (PRISM) Toxicity (LC50, mol/kg)
Gemcitabine −0.537988045 −2.417963872 2.381
Guanadrel −0.915635131 −0.411395434 2.38
Bemegride −3.718984186 1.008142951 1.532
Notes: *Denotes the mutation; +denotes overexpression on the corresponding biomarker.
Abbreviations: FOXO3: Forkhead box O3; LC50: Lethal concentration 50%; PRISMA: Pharmaceutical Regulatory Information System; TP53: Tumor
suppressor p53.
*
target pairs into feature vectors to enable input into the where d a represents the a-th drug feature, and d
a
DNN model. To generate the feature vectors, we used the indicates the a-th drug feature after standardization; σ a and
Protein Feature Server and PyBioMed tool in a Python µ a refer to the standard deviation and mean of the a-th
3.7 environment. The drug features encompass widely drug feature, respectively. A denotes the total number of
utilized structural and physicochemical data, while drug features.
the target features are derived from the structural and
physicochemical characteristics of proteins and peptides, Similarly,
determined from their amino acid sequences. Each drug- * t b
b
target pair was combined into a single feature vector. The t for b = 1,2…,B−1, B (XXXVII)
b
feature vector for the i-th drug-target pair in DTI databases b
can be presented as: where t b denotes the b-th target feature, and t
*
b
i
i
D T
q drug target d d ,, , d A1 , dt t ,, ,, t B1 , t , i i represents the b-th target feature after standardization; σ b
B
2
1
A
2
1
and µ b refer to the standard deviation and mean of the b-th
(XXXV) target feature, respectively; B represents the total number
for i=1,2…,180315, A + B = 1359 of target features.
The total feature vector dataset consists of 180,315 Given that the DNN-based DTI model (Figure 3)
entries, including 80,291 experimentally validated DTIs requires 996 input nodes, the total (A+B) feature vector
and 100,024 unvalidated interactions. To address the dimension needed to be reduced so that these drug-target
imbalance in the dataset, we downsampled the unvalidated feature vectors can be input to train the DNN-DTI model.
interactions to match the number of validated entries. By selecting the top 85% significant features for both drugs
Before training the DNN-DTI model, we standardized and targets using the principal component analysis (PCA),
and transformed the drug-target interaction data because we reduced the dimensionality of the features from 1,359
of variations in units among the different feature vectors. to 996. This reduction aligns with the model’s input layer
Standardization highlights the differences between each dimension and enhances training performance. 38
feature vector. The standardization of the features is shown
as follows: All the aforementioned data preprocessing steps were
performed to enable the DNN-DTI model to effectively
d
*
d a a for a = 1,2…,A−1, A (XXXVI) learn from feature data of drug-target interactions. After
a completing the data preprocessing, we split the dataset into
a
Volume 4 Issue 1 (2025) 57 doi: 10.36922/td.4709