
Page 66 - TD-4-1
P. 66
Tumor Discovery Drug repurposing for pancreatic cancer via AI
A B
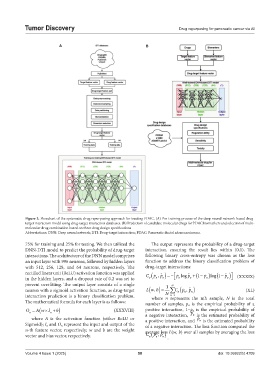
Figure 3. Flowchart of the systematic drug repurposing approach for treating PDAC. (A) Pre-training process of the deep neural network-based drug-
target interaction model using drug-target interaction databases. (B) Prediction of candidate molecular drugs for PDAC biomarkers and selection of multi-
molecular drug combination based on three drug design specifications
Abbreviations: DNN: Deep neural network; DTI: Drug-target interaction; PDAC: Pancreatic ductal adenocarcinoma.
75% for training and 25% for testing. We then utilized the The output represents the probability of a drug-target
DNN-DTI model to predict the probability of drug-target interaction, ensuring the result lies within (0,1). The
interactions. The architecture of the DNN model comprises following binary cross-entropy was chosen as the loss
an input layer with 996 neurons, followed by hidden layers function to address the binary classification problem of
with 512, 256, 128, and 64 neurons, respectively. The drug-target interactions:
rectified linear unit (ReLU) activation function was applied C ) = , ˆ − log + ˆ p ˆ p
n
in the hidden layers, and a dropout rate of 0.2 was set to n ( pp n n n ( − 1 p n ) ( −log 1 p n ) (XXXIX)
prevent overfitting. The output layer consists of a single 1 N
C
ˆ ,
neuron with a sigmoid activation function, as drug-target L ( ,wb ) = ∑ n ( p p n ) (XL)
n
N
interaction prediction is a binary classification problem. where n represents the nth sample, N is the total
=1
n
The mathematical formula for each layer is as follows: number of samples, p n is the empirical probability of a
O n b (XXXVIII) positive interaction, 1−p n is the empirical probability of
A wI
ˆ p
n
ˆ p
where A is the activation function (either ReLU or a negative interaction, n is the estimated probability of
is the estimated probability
a positive interaction, and
n
Sigmoid); I n and O n represent the input and output of the of a negative interaction. The loss function computed the
n-th feature vector, respectively; w and b are the weight average loss L(w, b) over all samples by averaging the loss
ˆ ,
vector and bias vector, respectively. C n ( pp n ) .
n
Volume 4 Issue 1 (2025) 58 doi: 10.36922/td.4709