
Page 135 - AC-3-2
P. 135
Arts & Communication Constructing the image of ancient cities
For example, the Residential Quarter, which scholars used process and its location to the east of the new urban
to name as Aristocratic Area owing to the high quality of artifact, the Royal Palace. This area was consequently the
buildings’ materiality, comprises many small and simple first area to be influenced by the new architectural and
houses whose area is sometimes around 60 square meters urban developments in the city after building the Royal
and which consist of four simple spaces. On the other hand, Palace. As it was confirmed by the archeological sounding
some big and rich houses (house B and block X) which reflect at the eastern part of the Royal Palace, the Royal Area and
the owner’s importance and wealth are located in the South Residential Quarter were occupied by dispersed simple
City area. This house accommodated several professional and poor houses; this facilitated radical improvements in
workshops and storage. Archeological analysis pointed this part of the city, unlike the case of the areas around the
out that the northern part of this house, at least, was most temples where most inhabitants had lived in dense fabric.
probably built in three storeys, whereas the southern part This resulted in well-constructed and organized structures
was built in two storeys (Figure 15). This strongly reflects and urban areas, which do not necessarily reflect the
that the house owner was a member of a higher-position wealth of the inhabitants, but rather the professional status,
social group and did, nevertheless, build their house in the functions, and the developed architectural, social, and
same area where many simple and poor houses existed. cultural trends, and urban principles.
The better materiality of the buildings at the Residential Based on the written sources, it was confirmed that
35
Quarter can be attributed to the urban development the palace controlled the city’s trade with other cities and
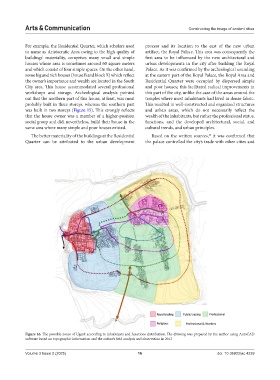
Figure 16. The possible zones of Ugarit according to inhabitants and functions distribution. The drawing was prepared by the author using AutoCAD
software based on topographic information and the author’s field analysis and observation in 2013
Volume 3 Issue 2 (2025) 16 doi: 10.36922/ac.4239