
Page 128 - AIH-1-2
P. 128
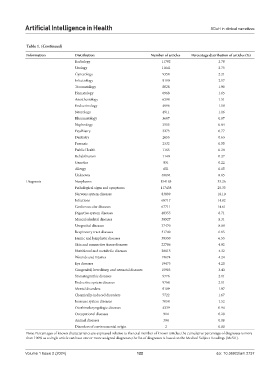
Artificial Intelligence in Health                                              SDoH in clinical narratives


            Table 1. (Continued)
            Information          Distribution                    Number of articles  Percentage distribution of articles (%)
                                 Radiology                            11792                   2.78
                                 Urology                              11641                   2.75
                                 Gynecology                           9354                    2.21
                                 Infectiology                         9190                    2.17
                                 Traumatology                         8028                    1.90
                                 Hematology                           6968                    1.65
                                 Anesthesiology                       6398                    1.51
                                 Endocrinology                        4996                    1.18
                                 Neurology                            4911                    1.16
                                 Rheumatology                         3687                    0.87
                                 Nephrology                           3555                    0.84
                                 Psychiatry                           3273                    0.77
                                 Dentistry                            2655                    0.63
                                 Forensic                             2332                    0.55
                                 Public Health                        1165                    0.28
                                 Rehabilitation                       1140                    0.27
                                 Genetics                             931                     0.22
                                 Allergy                              651                     0.15
                                 Unknown                              40094                   8.65
            Diagnosis            Neoplasms                           154185                   33.26
                                 Pathological signs and symptoms     117438                   25.33
                                 Nervous system diseases              83899                   18.10
                                 Infections                           68717                   14.82
                                 Cardiovascular diseases              67711                   14.61
                                 Digestive system diseases            40355                   8.71
                                 Musculoskeletal diseases             38527                   8.31
                                 Urogenital diseases                  37470                   8.08
                                 Respiratory tract diseases           31740                   6.85
                                 Hemic and lymphatic diseases         30350                   6.55
                                 Skin and connective tissue diseases  22786                   4.92
                                 Nutritional and metabolic diseases   20015                   4.32
                                 Wounds and injuries                  19674                   4.24
                                 Eye diseases                         19475                   4.20
                                 Congenital, hereditary, and neonatal diseases  15903         3.43
                                 Stomatognathic diseases              9776                    2.11
                                 Endocrine system diseases            9768                    2.11
                                 Mental disorders                     9109                    1.97
                                 Chemically-induced disorders         7722                    1.67
                                 Immune system diseases               7054                    1.52
                                 Otorhinolaryngologic diseases        4339                    0.94
                                 Occupational diseases                914                     0.20
                                 Animal diseases                      394                     0.08
                                 Disorders of environmental origin     2                      0.00
            Note: Percentages of known characteristics are expressed relative to the total number of known articles; the cumulative percentage of diagnoses is more
            than 100% as a single article can have one or more assigned diagnoses; the list of diagnoses is based on the Medical Subject Headings (MeSH).


            Volume 1 Issue 2 (2024)                        122                               doi: 10.36922/aih.2737